This project is part of a Human Computer Interaction (HCI) research paper I completed with Zhihan Zhang, a third year Ph.D. student at Paul G. Allen School of Computer Science & Engineering:
In today's digital age, both researchers and the public face challenges in interpreting complex data. Life-Cycle Assessment (LCA) and sustainability articles, often published as static PDFs or online text, hinder researchers' ability to extract and analyze data effectively.
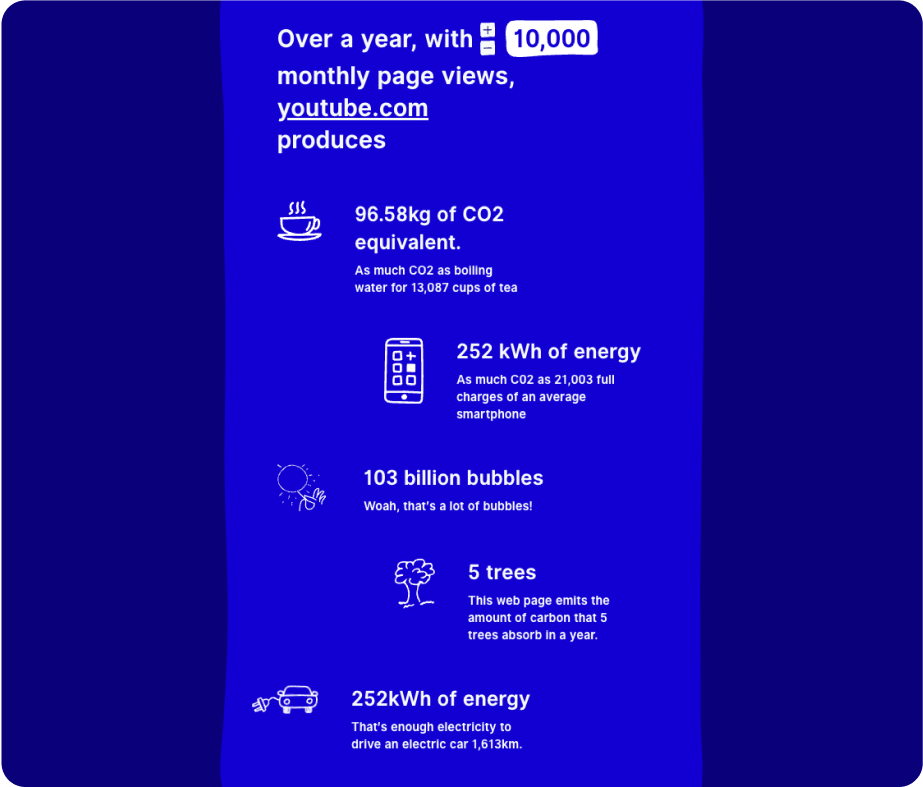
Similarly, the public struggles to contextualize carbon emissions data like "10.3 kg CO₂-eq," which lacks relatable reference points, making it hard to understand its impact on daily decisions.
To address these challenges, we propose to explore the following research questions:
1. How can we enhance the ability of LCA researchers to extract, visualize, and analyze data within online research articles more effectively?
2. How can we help environmentally conscious individuals explore and understand the environmental impact of their choices and make more sustainable decisions?
Solution at a glance
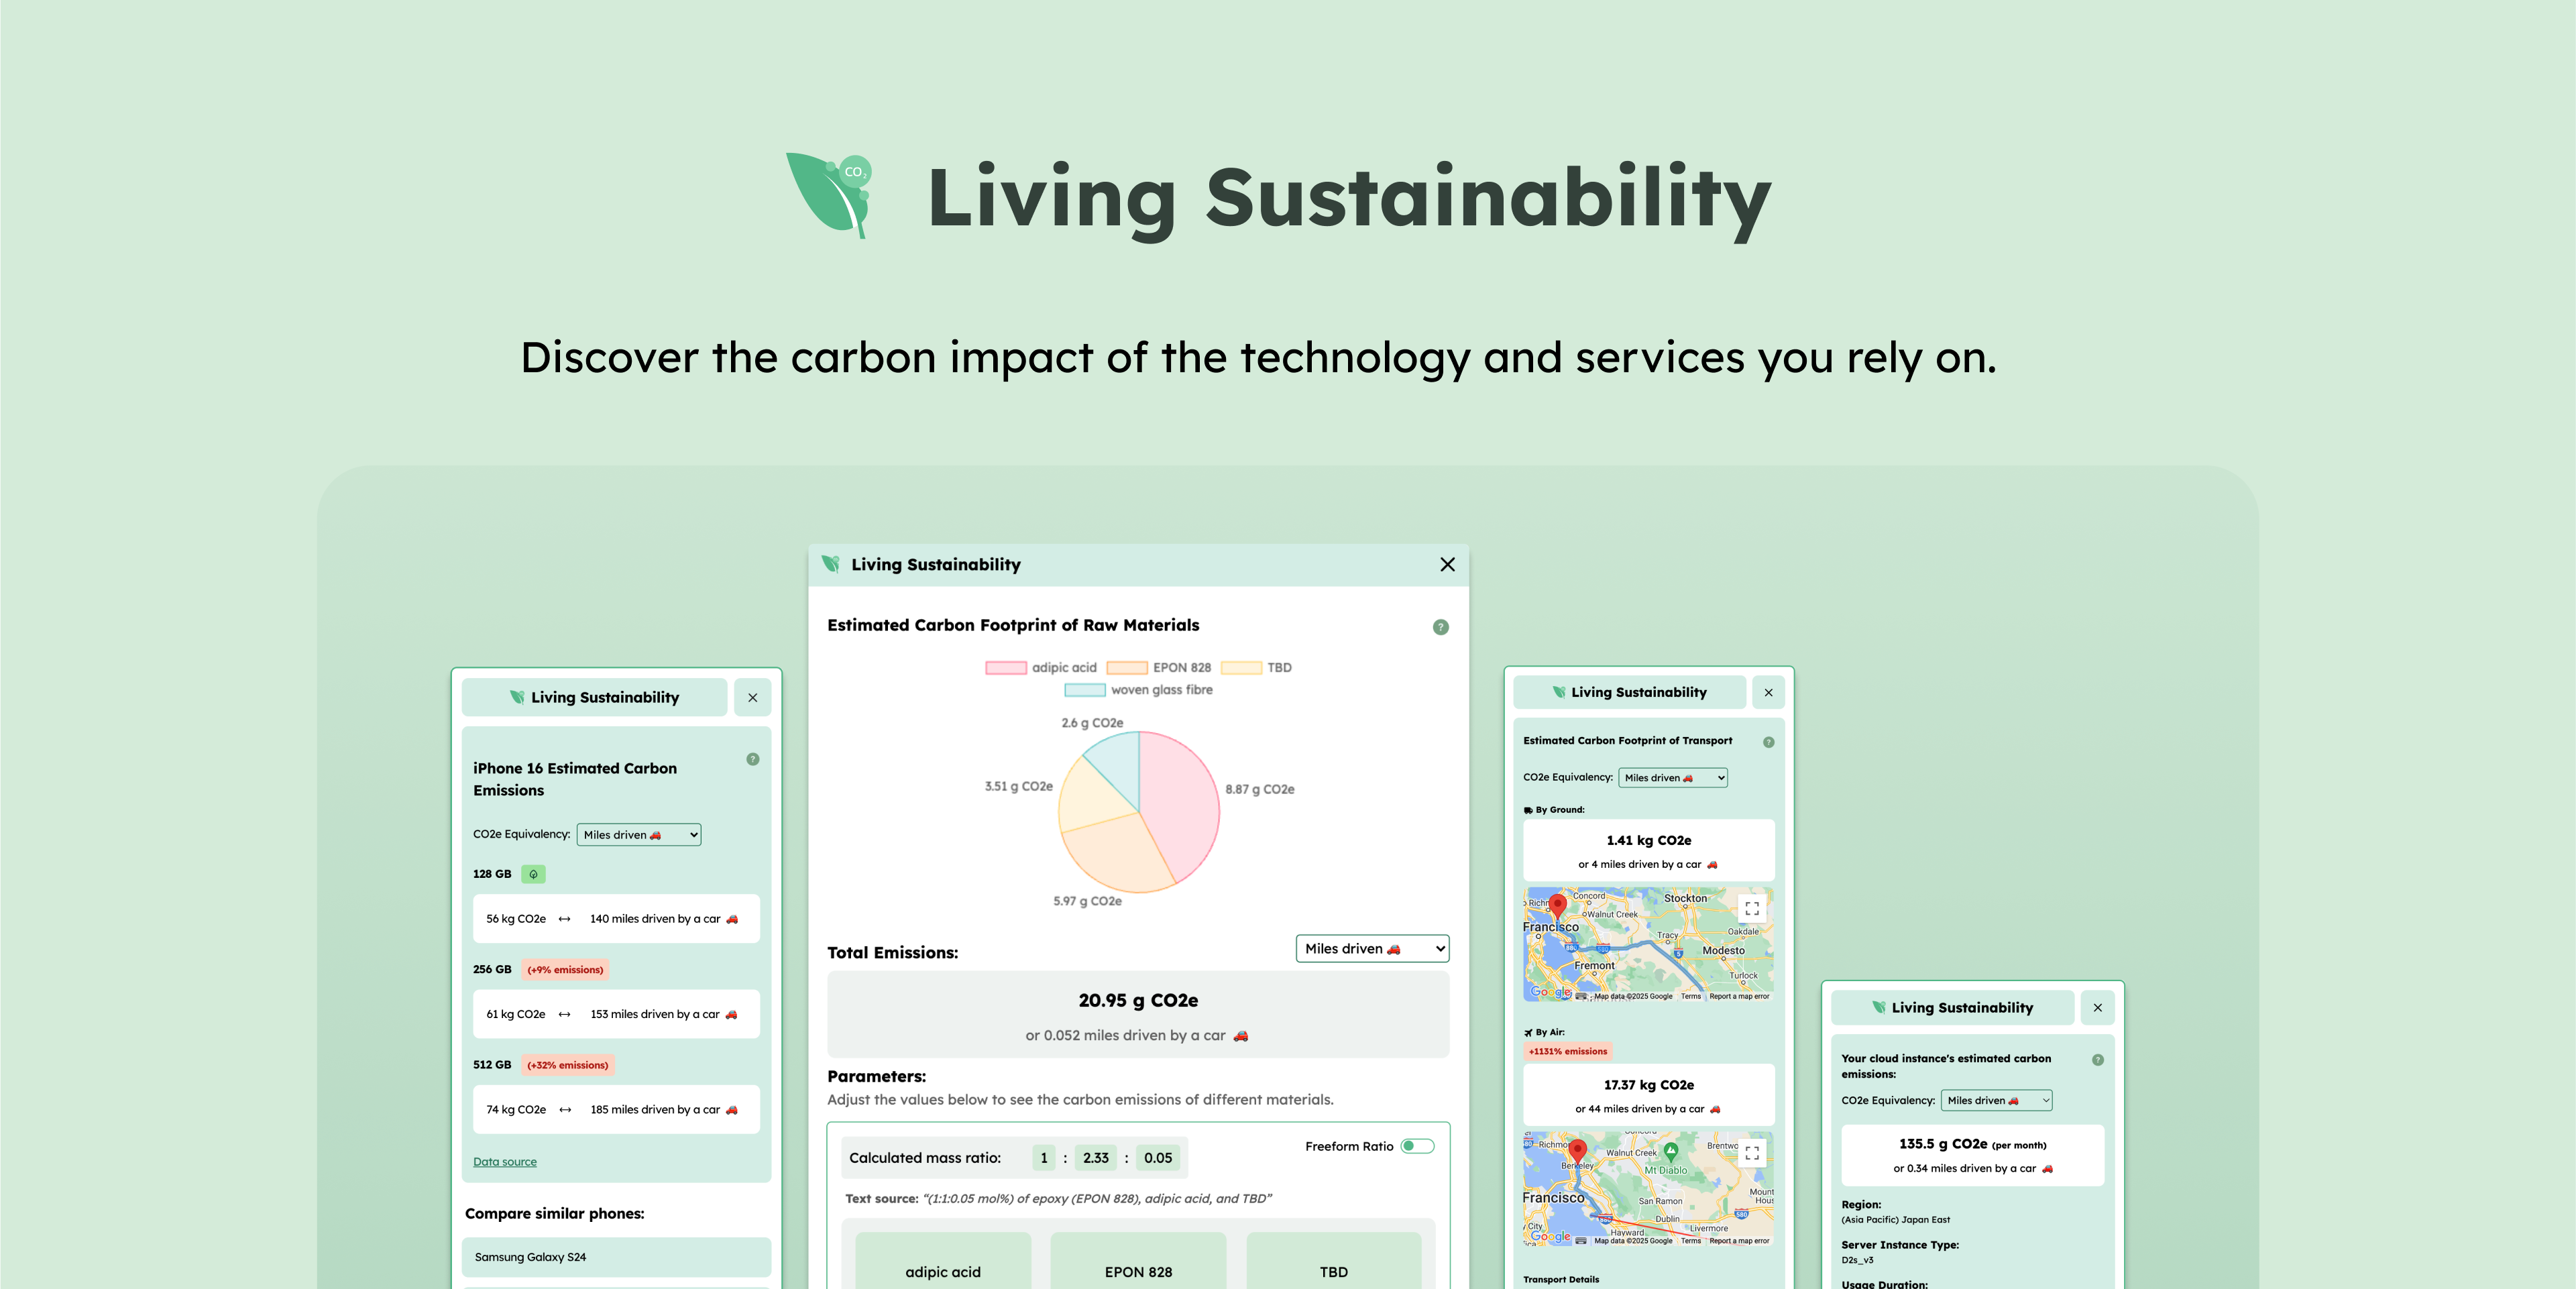
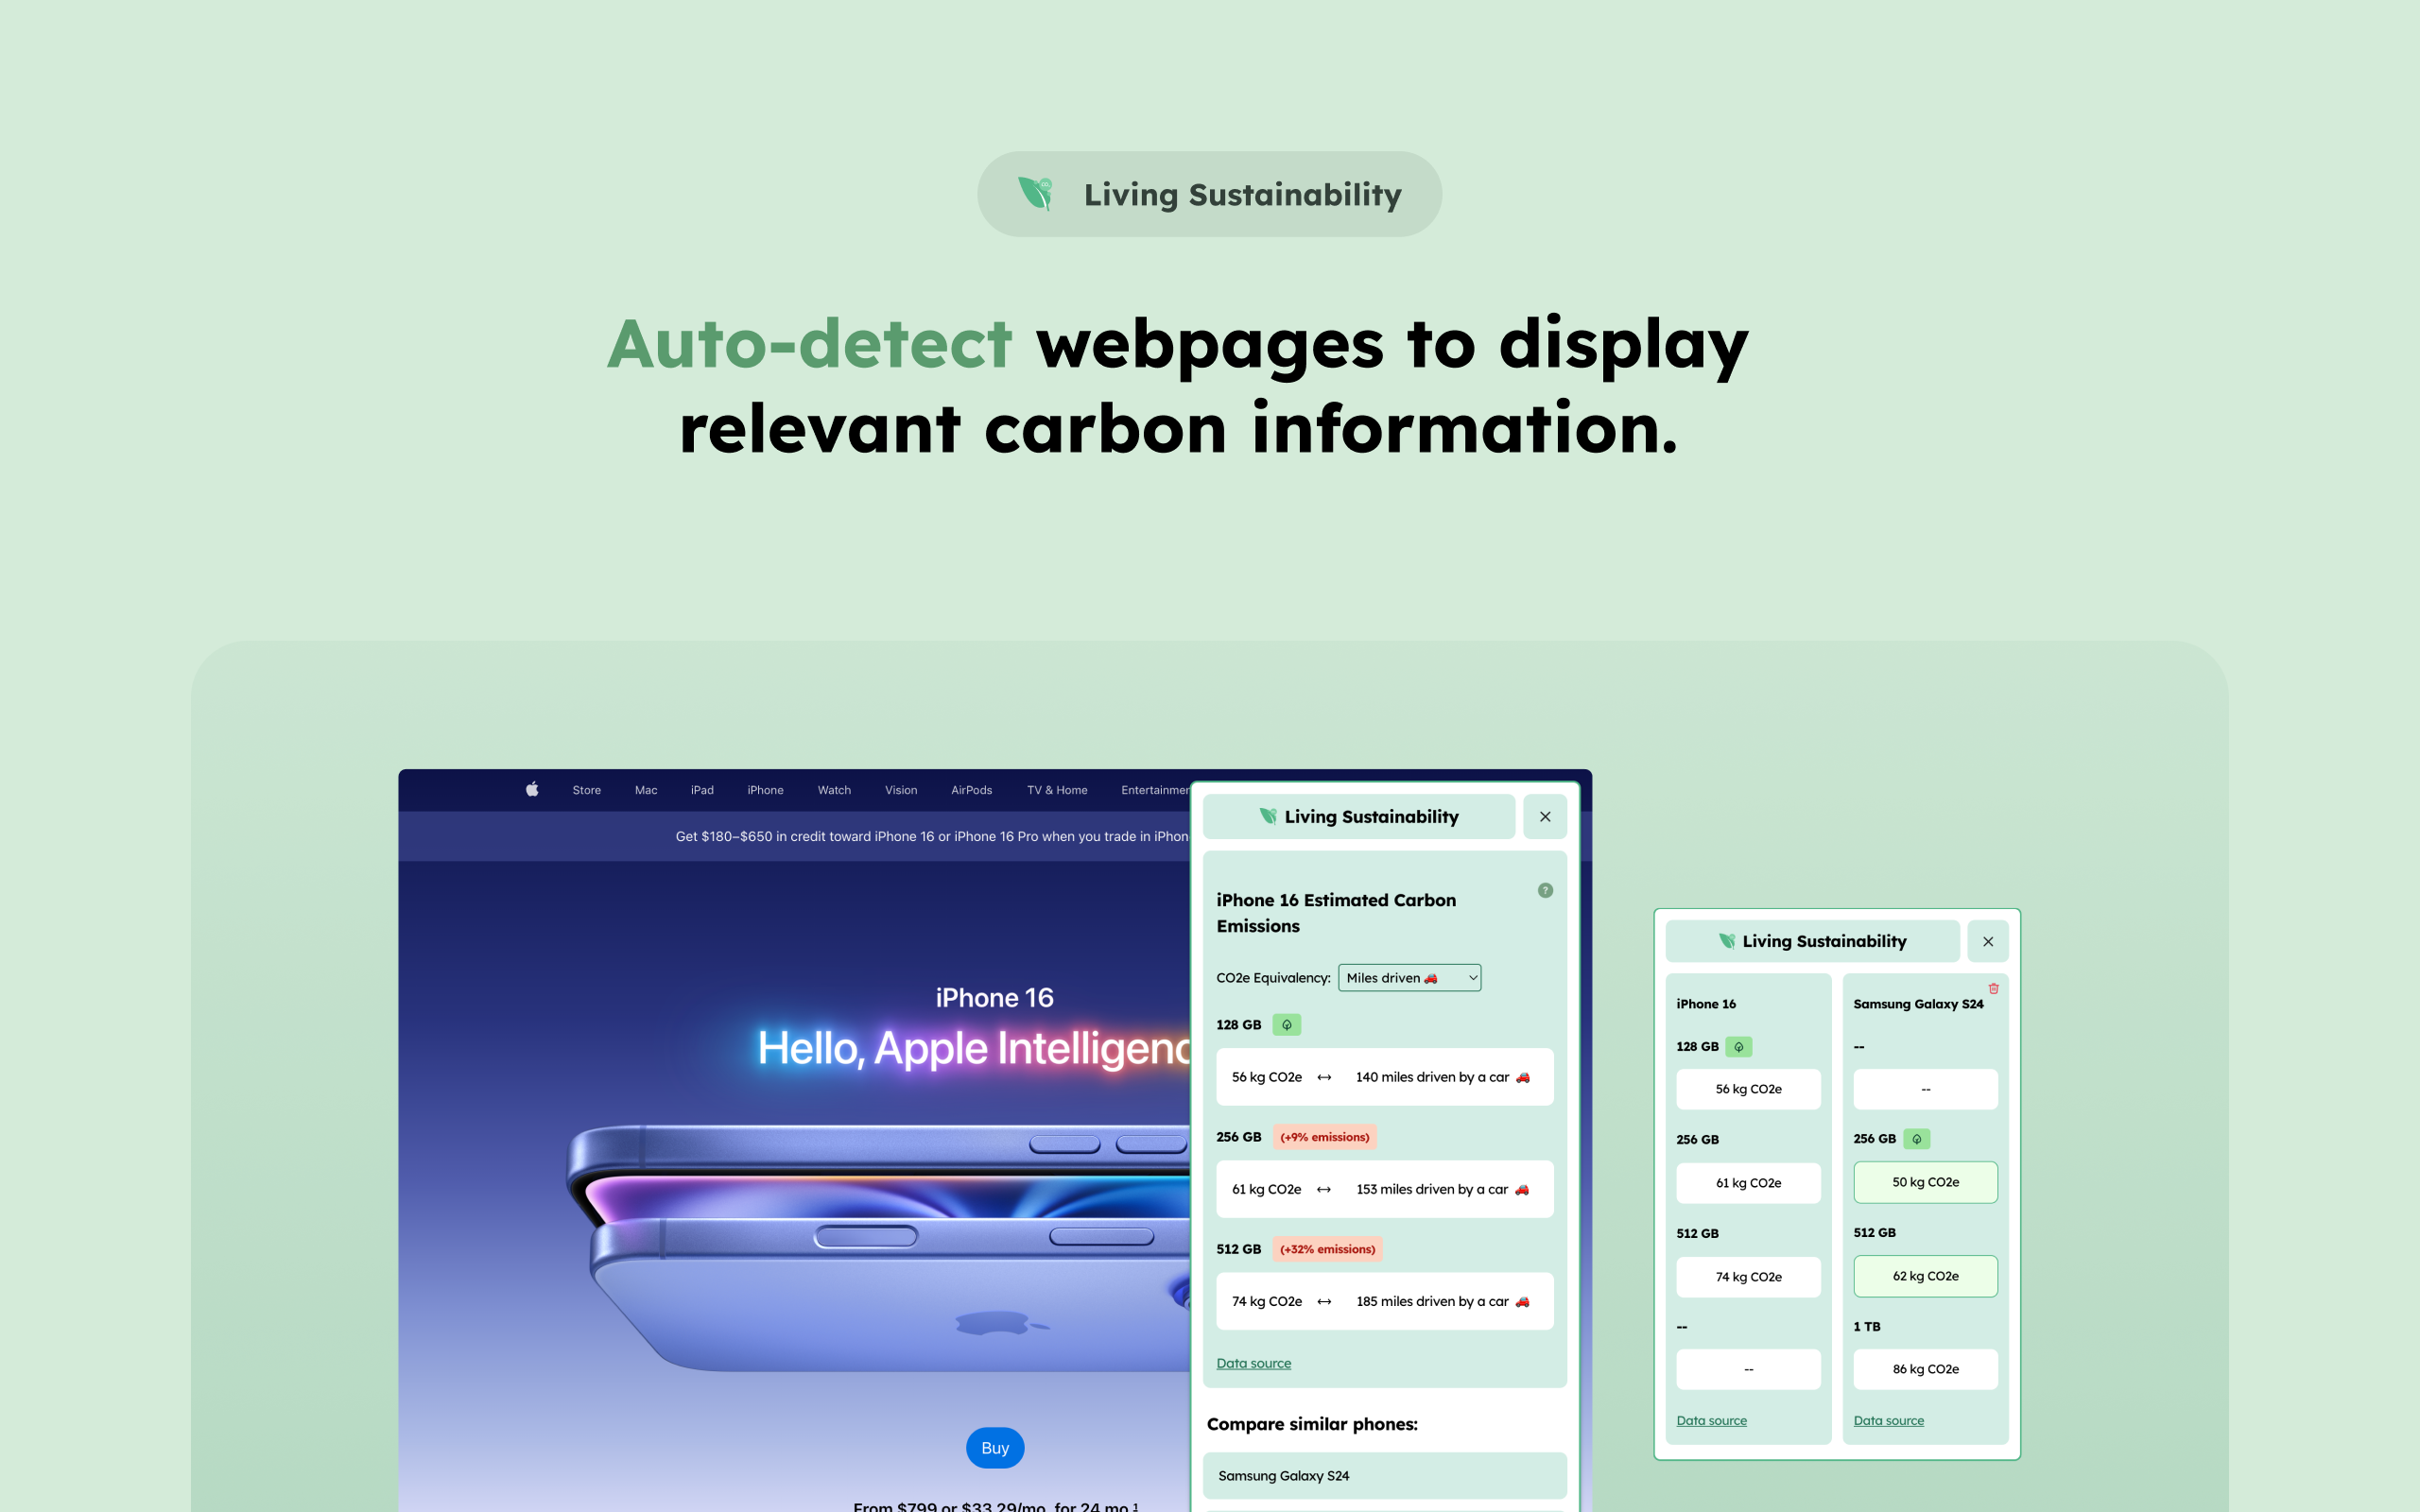
We developed Living Sustainability, an AI-based Chrome Extension that makes understanding carbon emissions easy and engaging by turning complex environmental data into interactive visualizations.
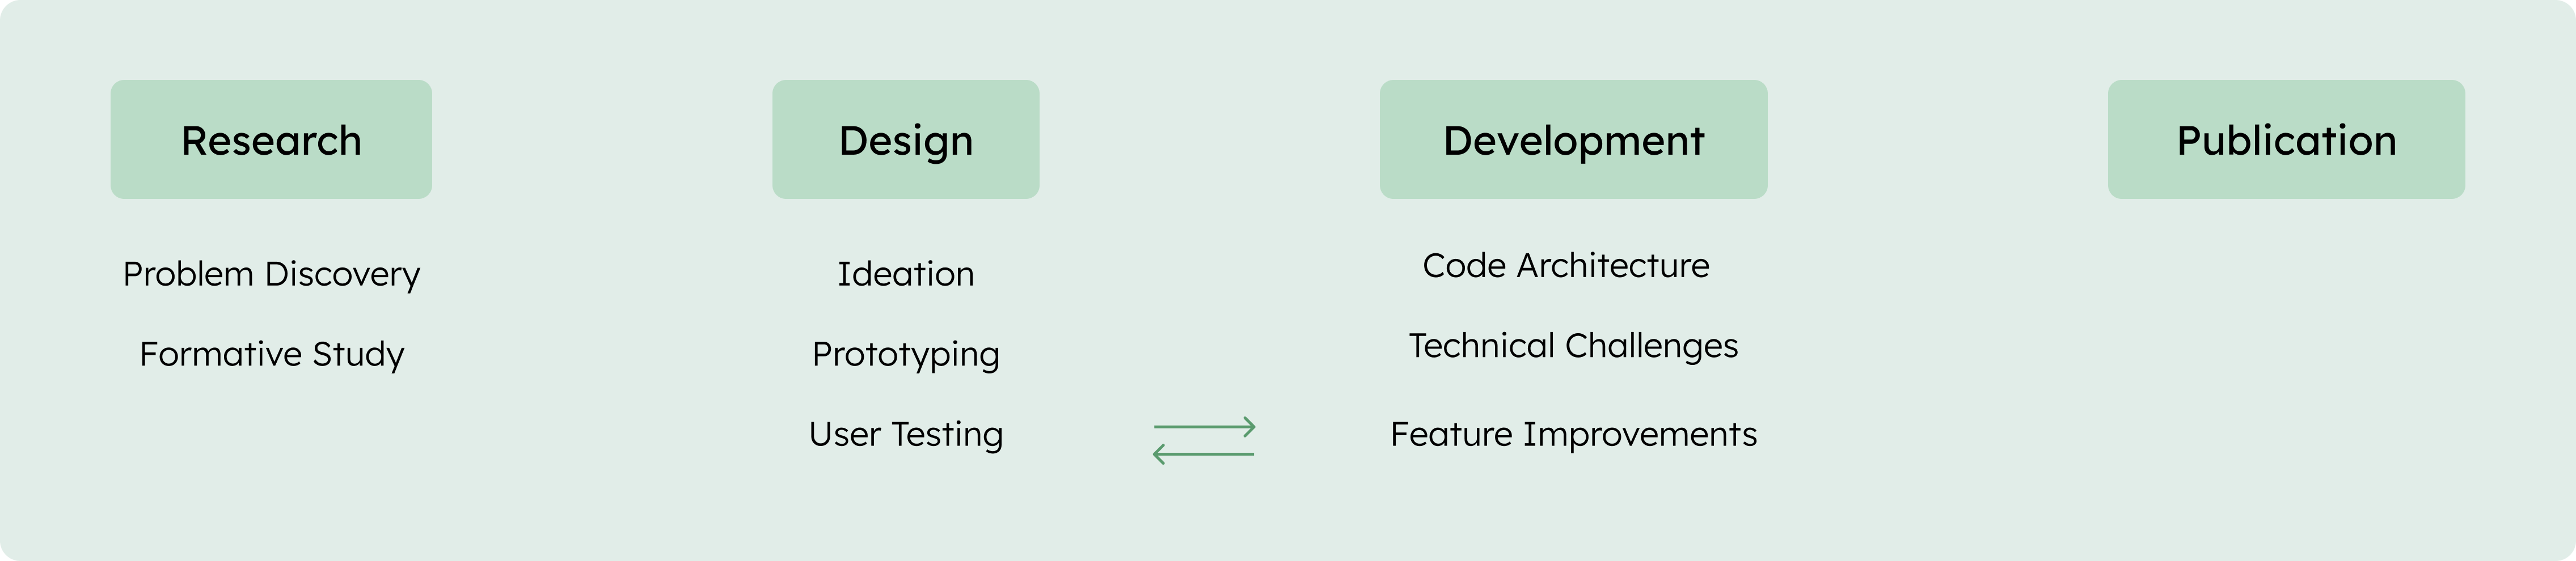
RESEARCH
Formative Study
I conducted a formative study interviewing environmentally conscious individuals and LCA researchers in order to learn about their:
Understanding of carbon emissions
Current methods and pain points for finding carbon related information
Motivation to make sustainable decisions
This is what I learned from the formative study:
Individuals
80%Don't understand the meaning of 'CO₂e' on its own. They need a comparison or relatable example to put it into context.
70%Finds it difficult and inconvenient to find the carbon emissions of a product they buy or a service they use.
90%Wants a tool that help them understand the environmental impact of their choices.
LCA researchers
60%Would benefit from a tool that helps them visualize carbon data from articles they read online.
70%Wants a tool that help them understand the environmental impact of their choices.
DESIGN
Ideation
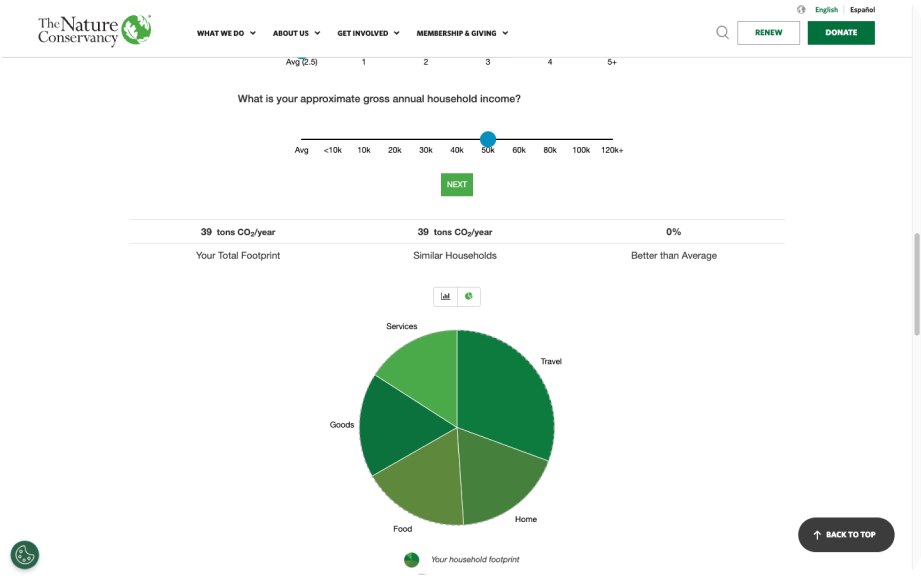
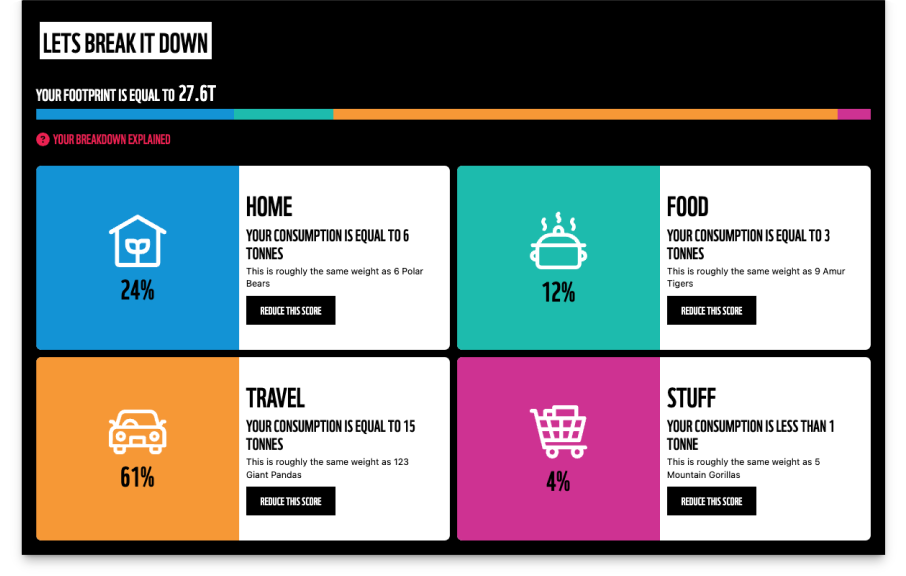
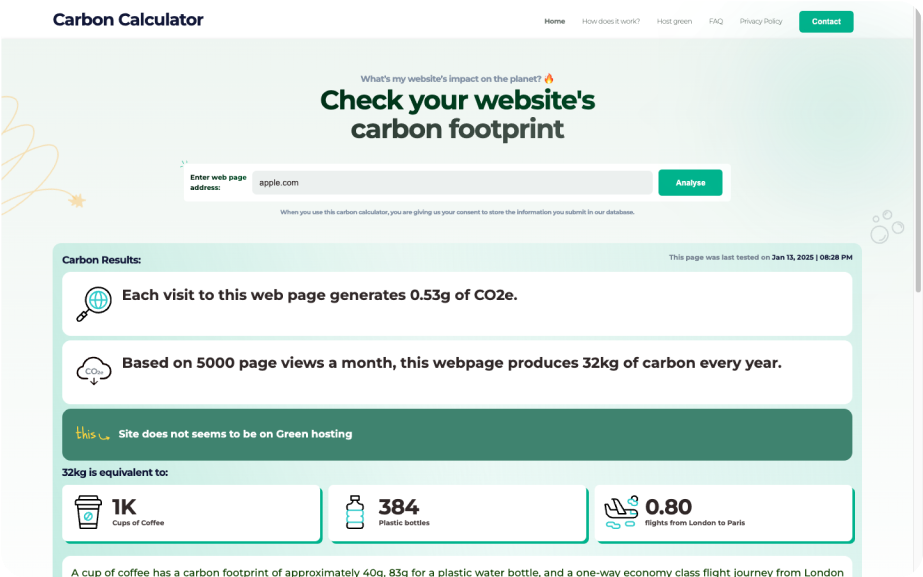
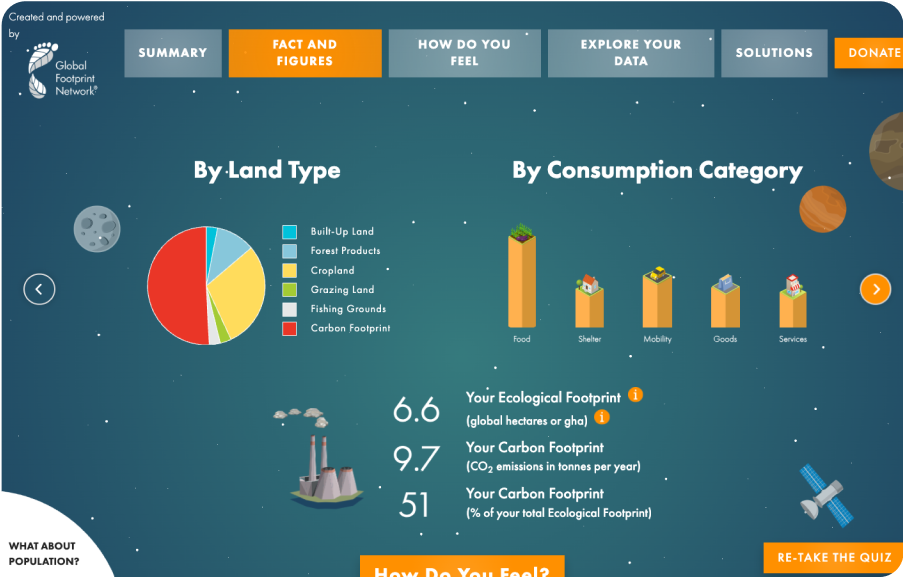
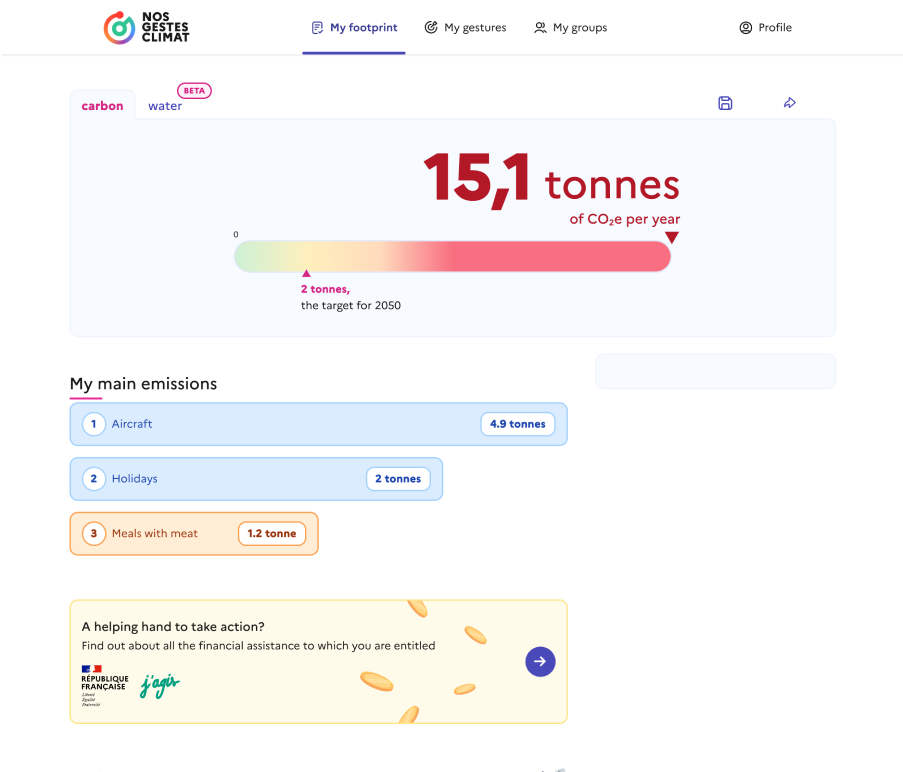
I researched different websites that provide carbon footprint estimation services for their users, and took notes on how they presented their data (e.g. charts and figures), what kind of carbon comparisons they make, and how they prompt users for information. This helped me figure out how I wanted my Chrome extension to work and what information would be the most helpful for users to see.
DESIGN
Prototyping
I created an initial prototype that explores different scenarios the user can interact with the extension.
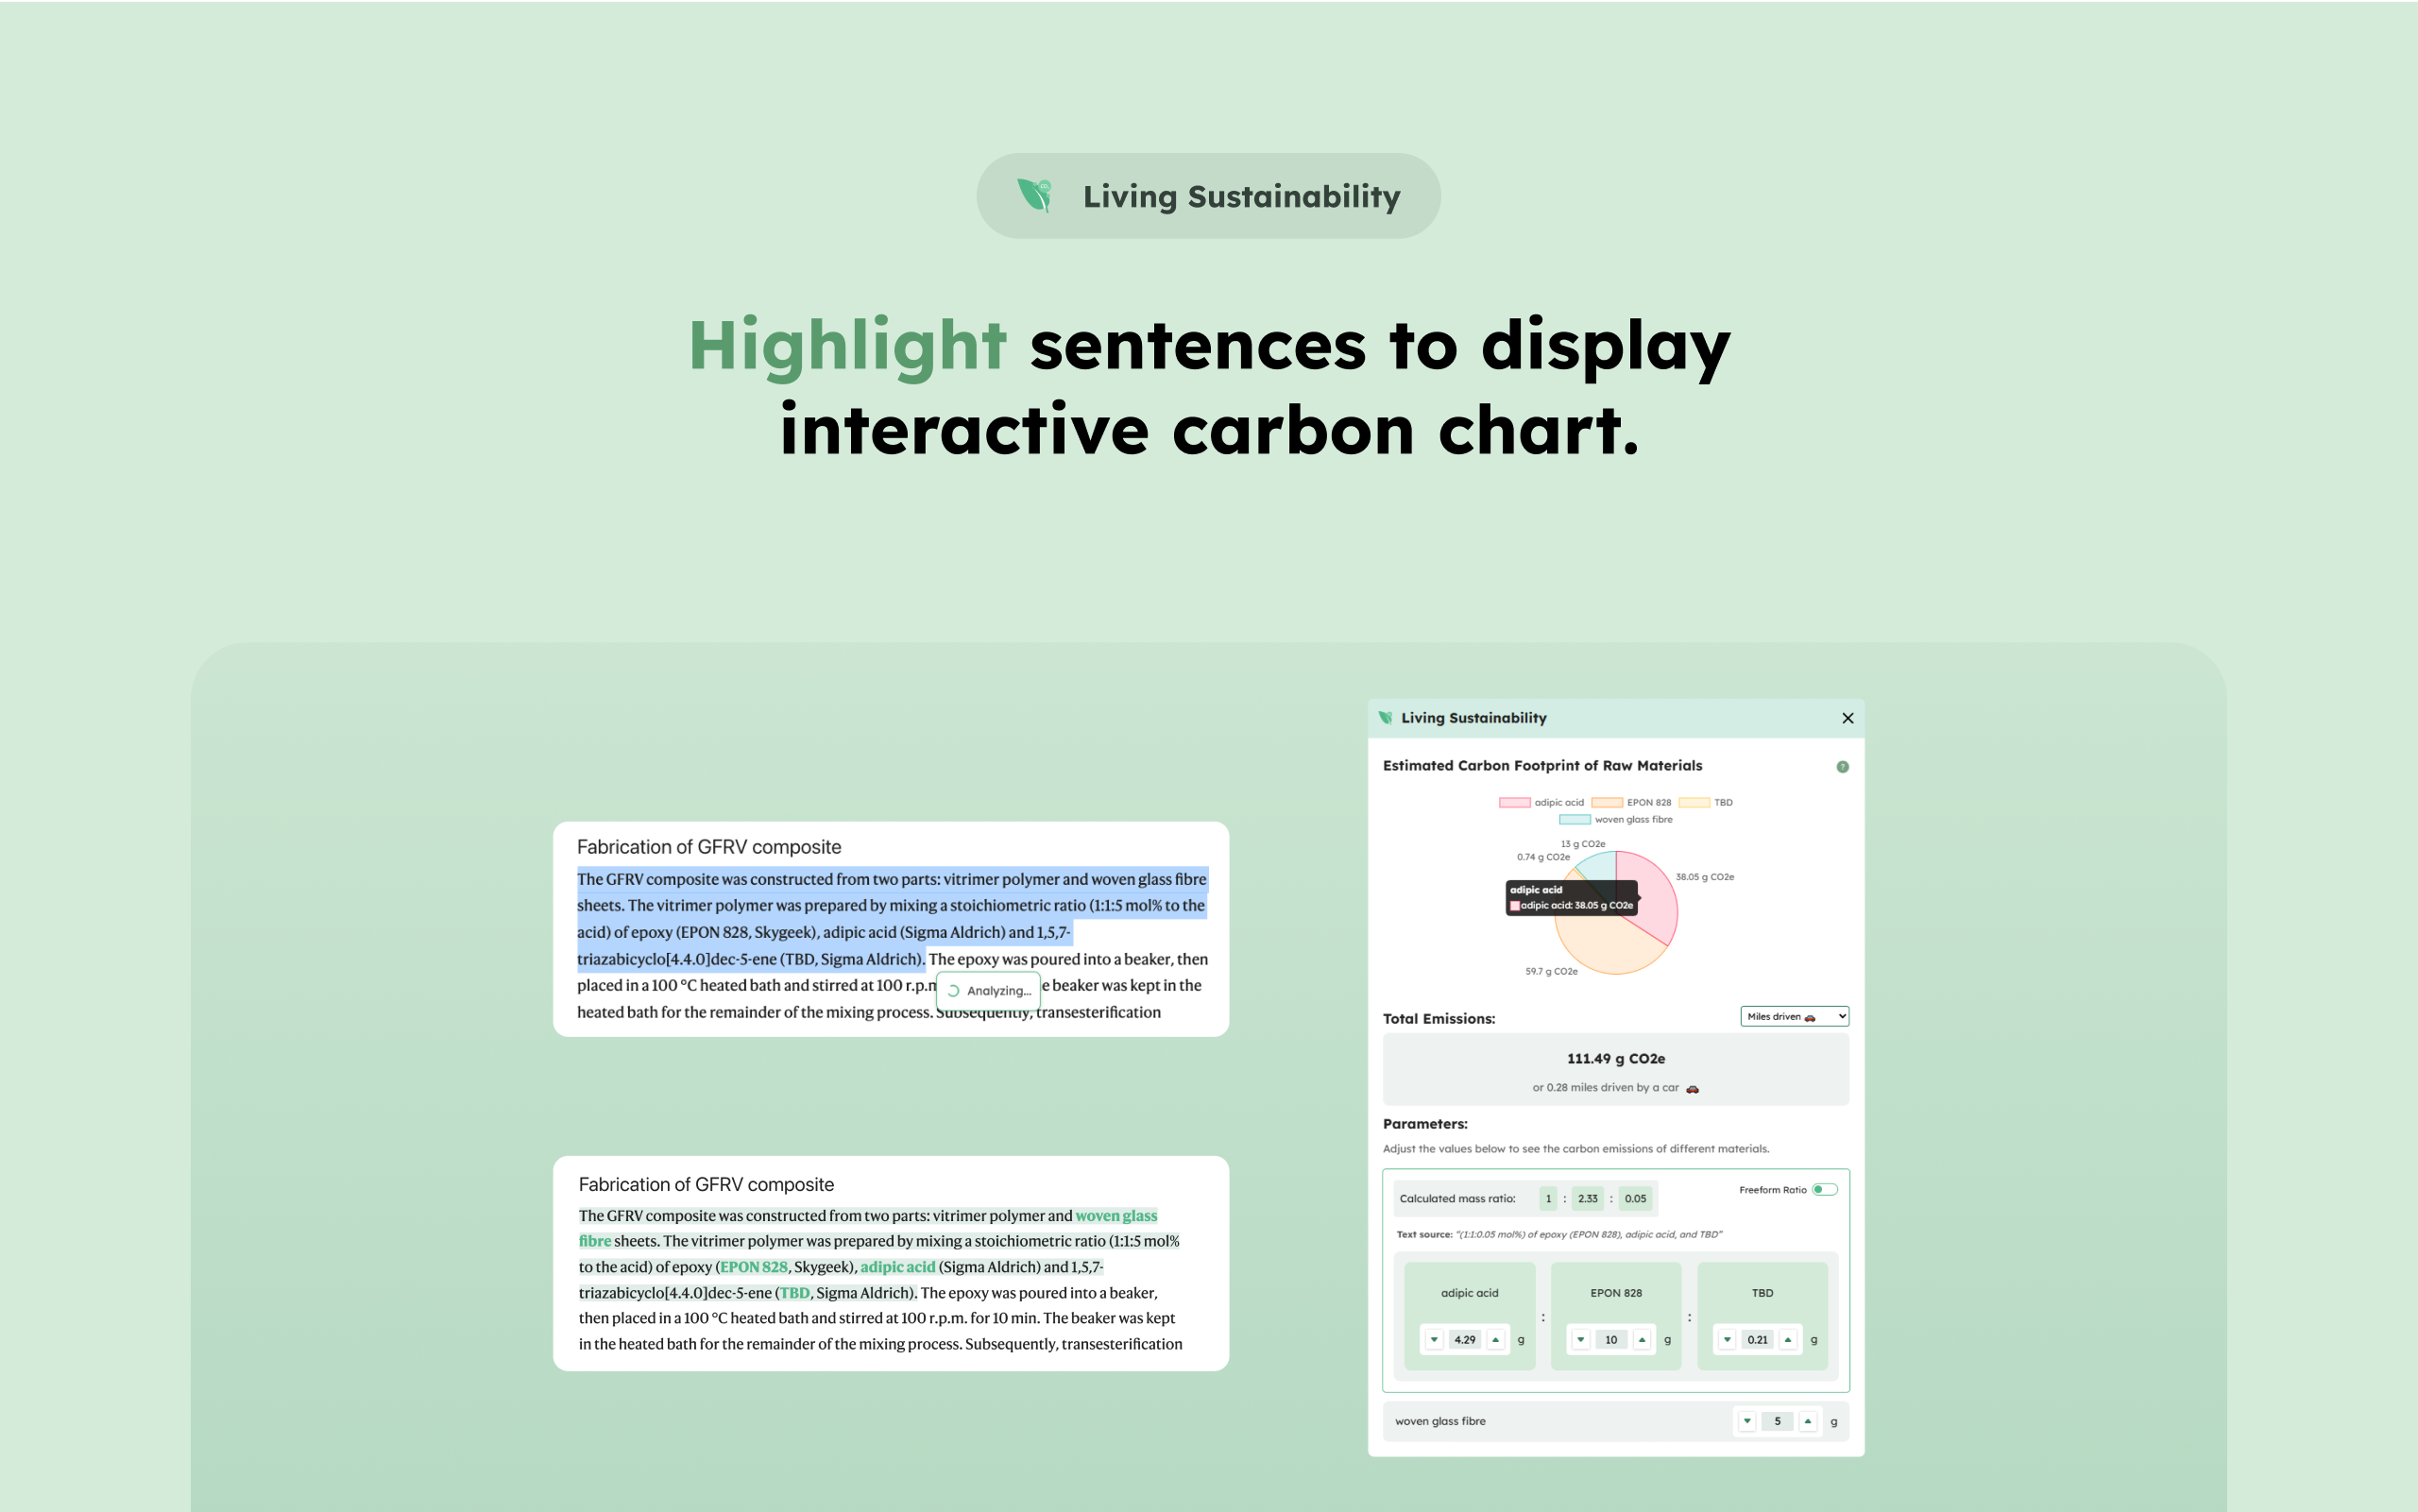
1. Highlight a text
2. Display interactive carbon chart
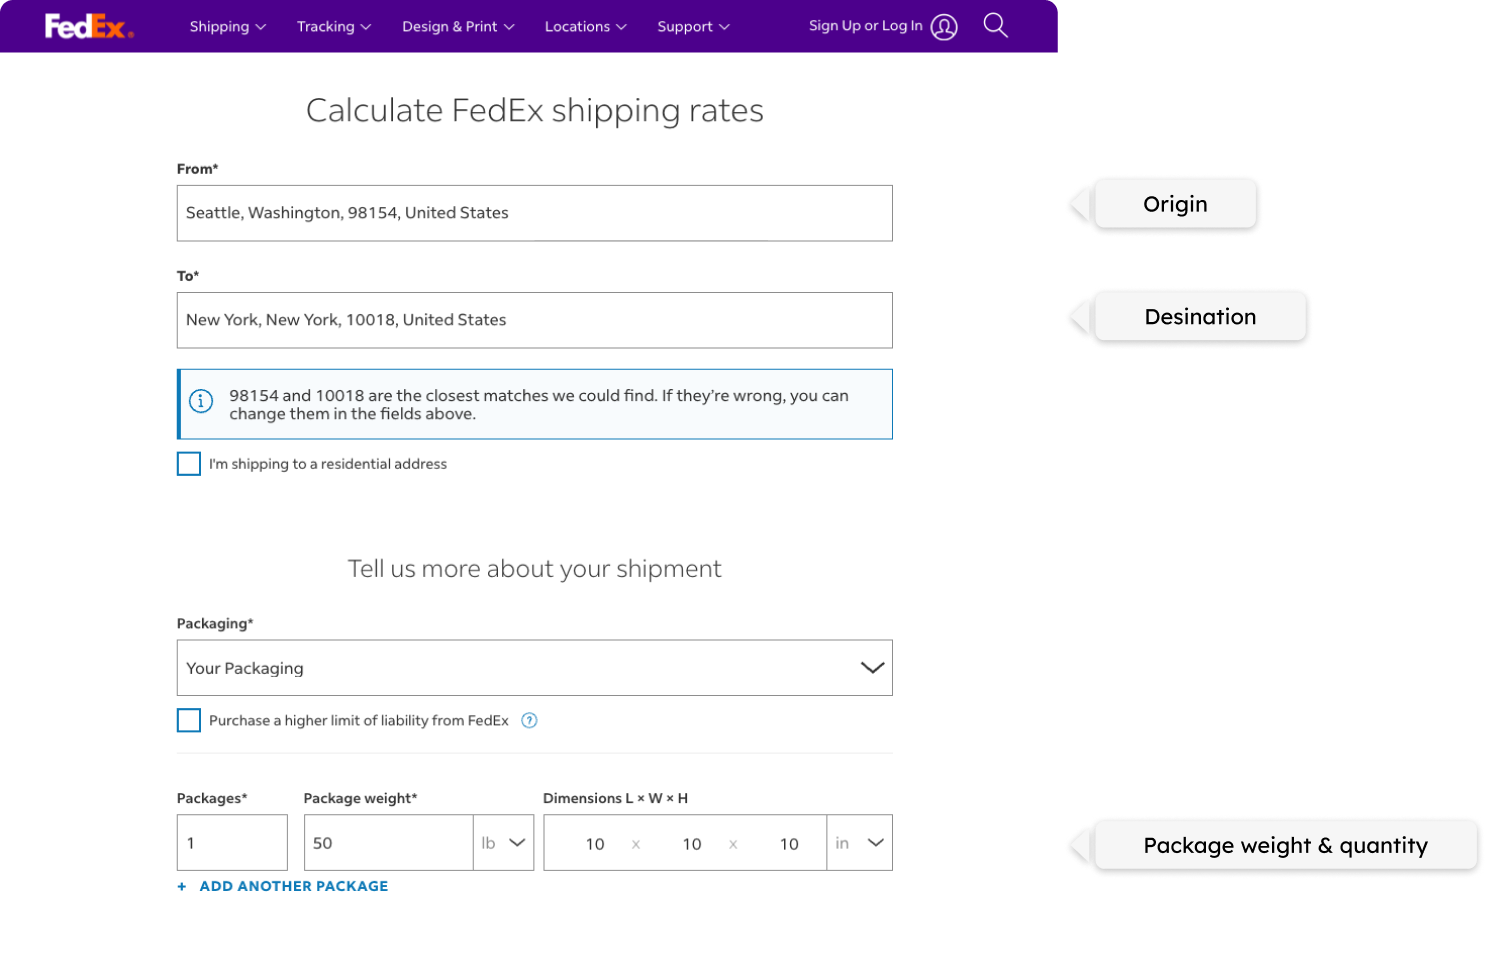
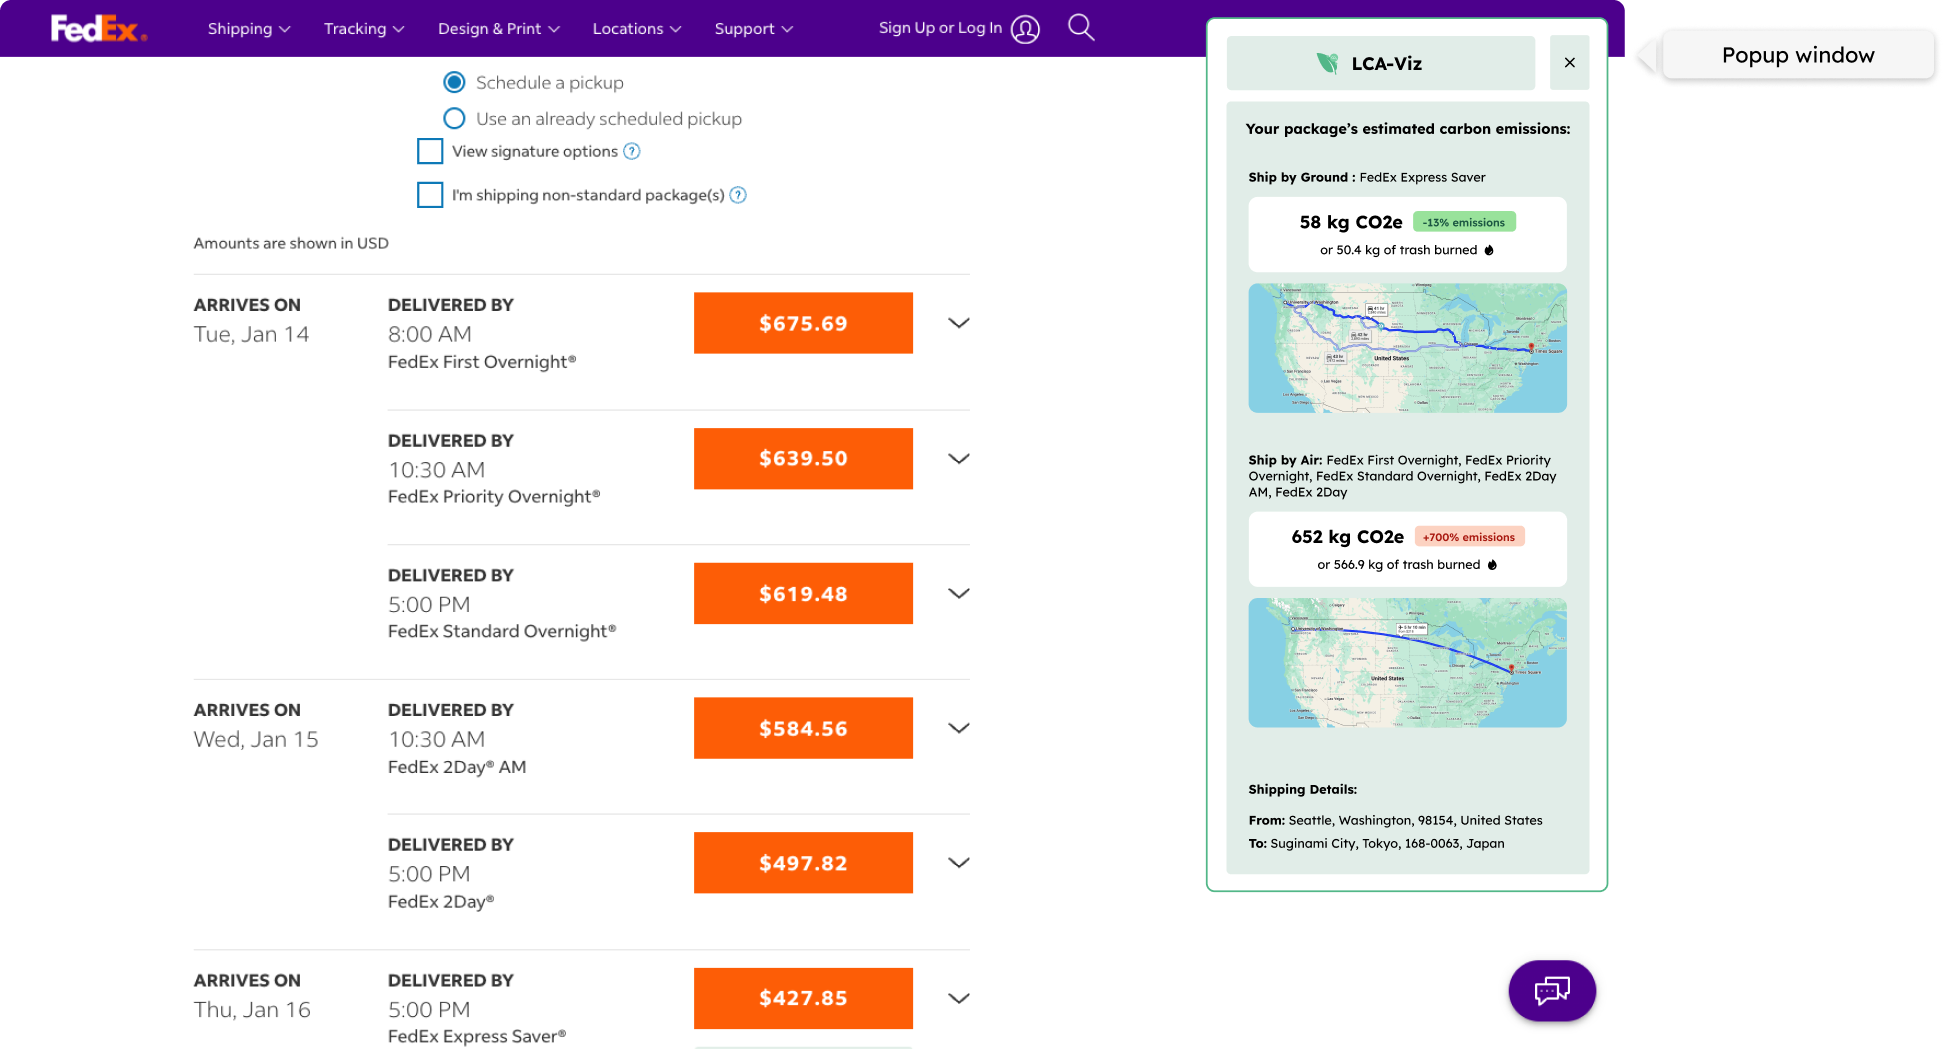
1. Detect shipping information on Fedex
2. Display carbon emissions for shipping
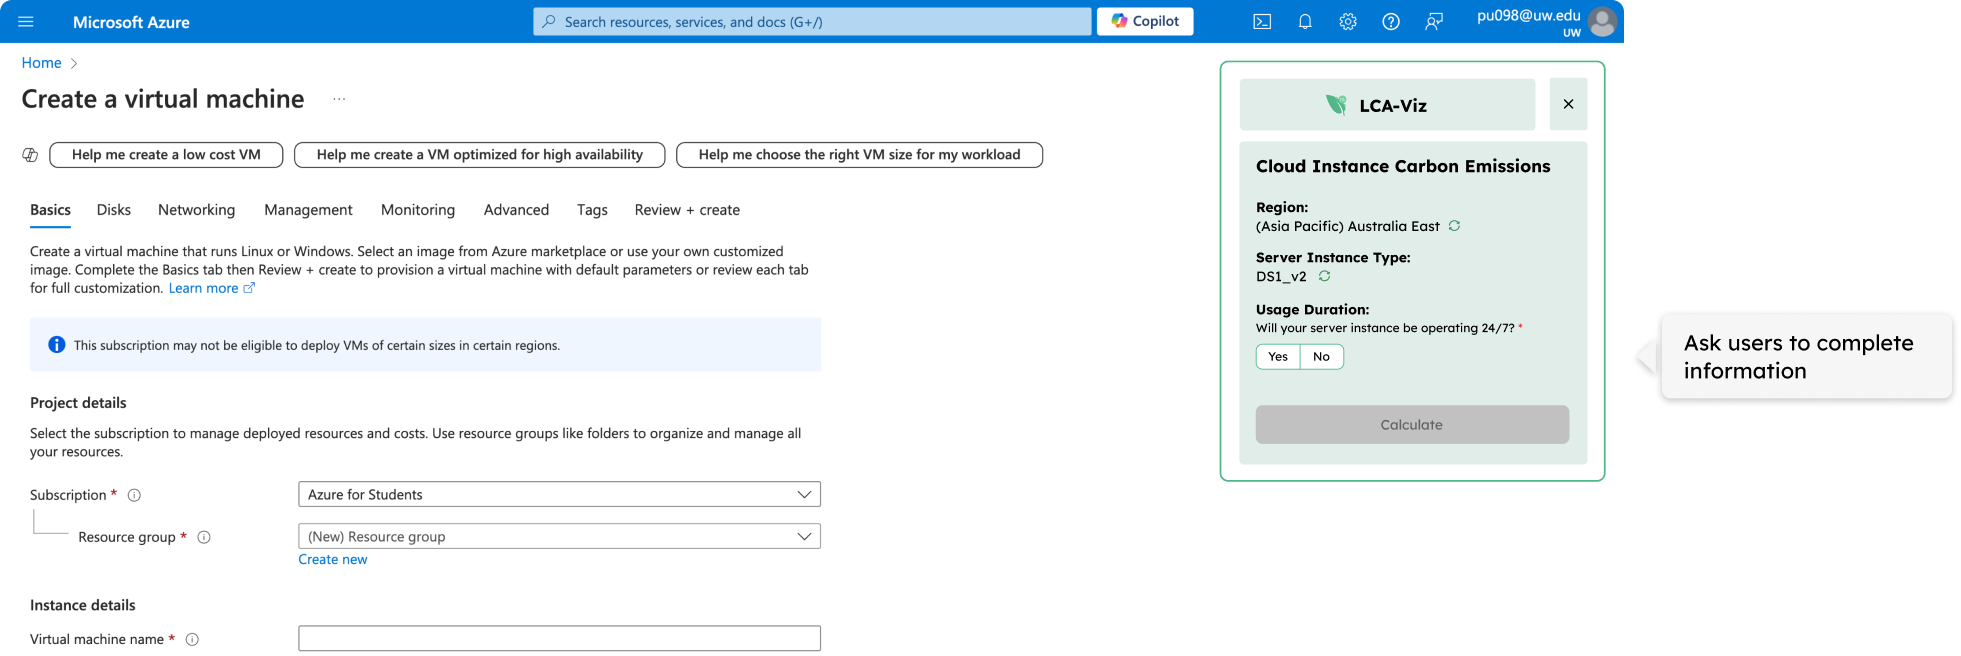
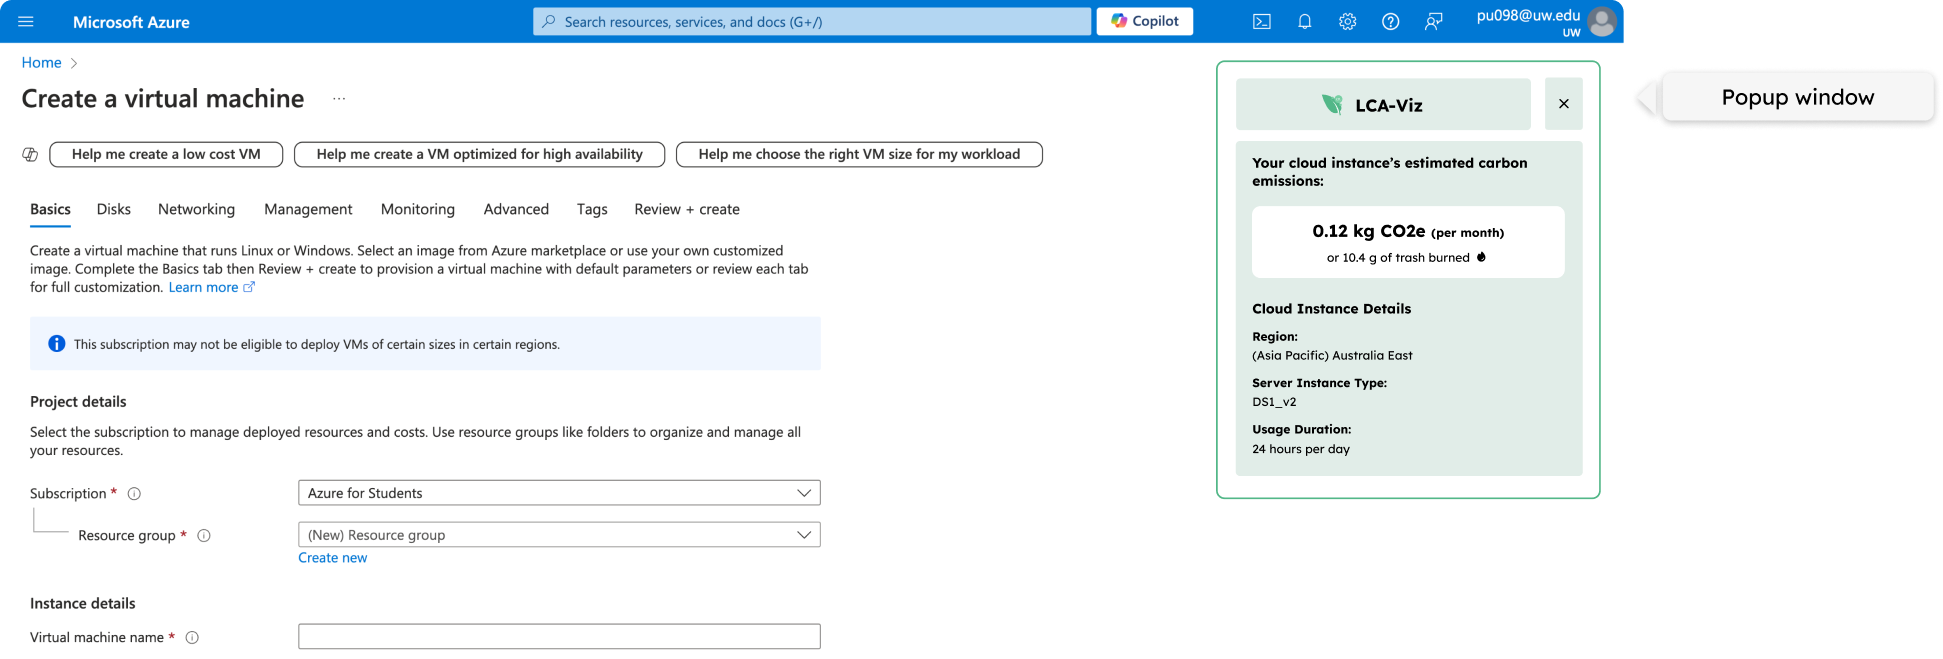
1. Detect virtual server information on Microsoft Azure
2. Display carbon emissions for hosting virtual servers
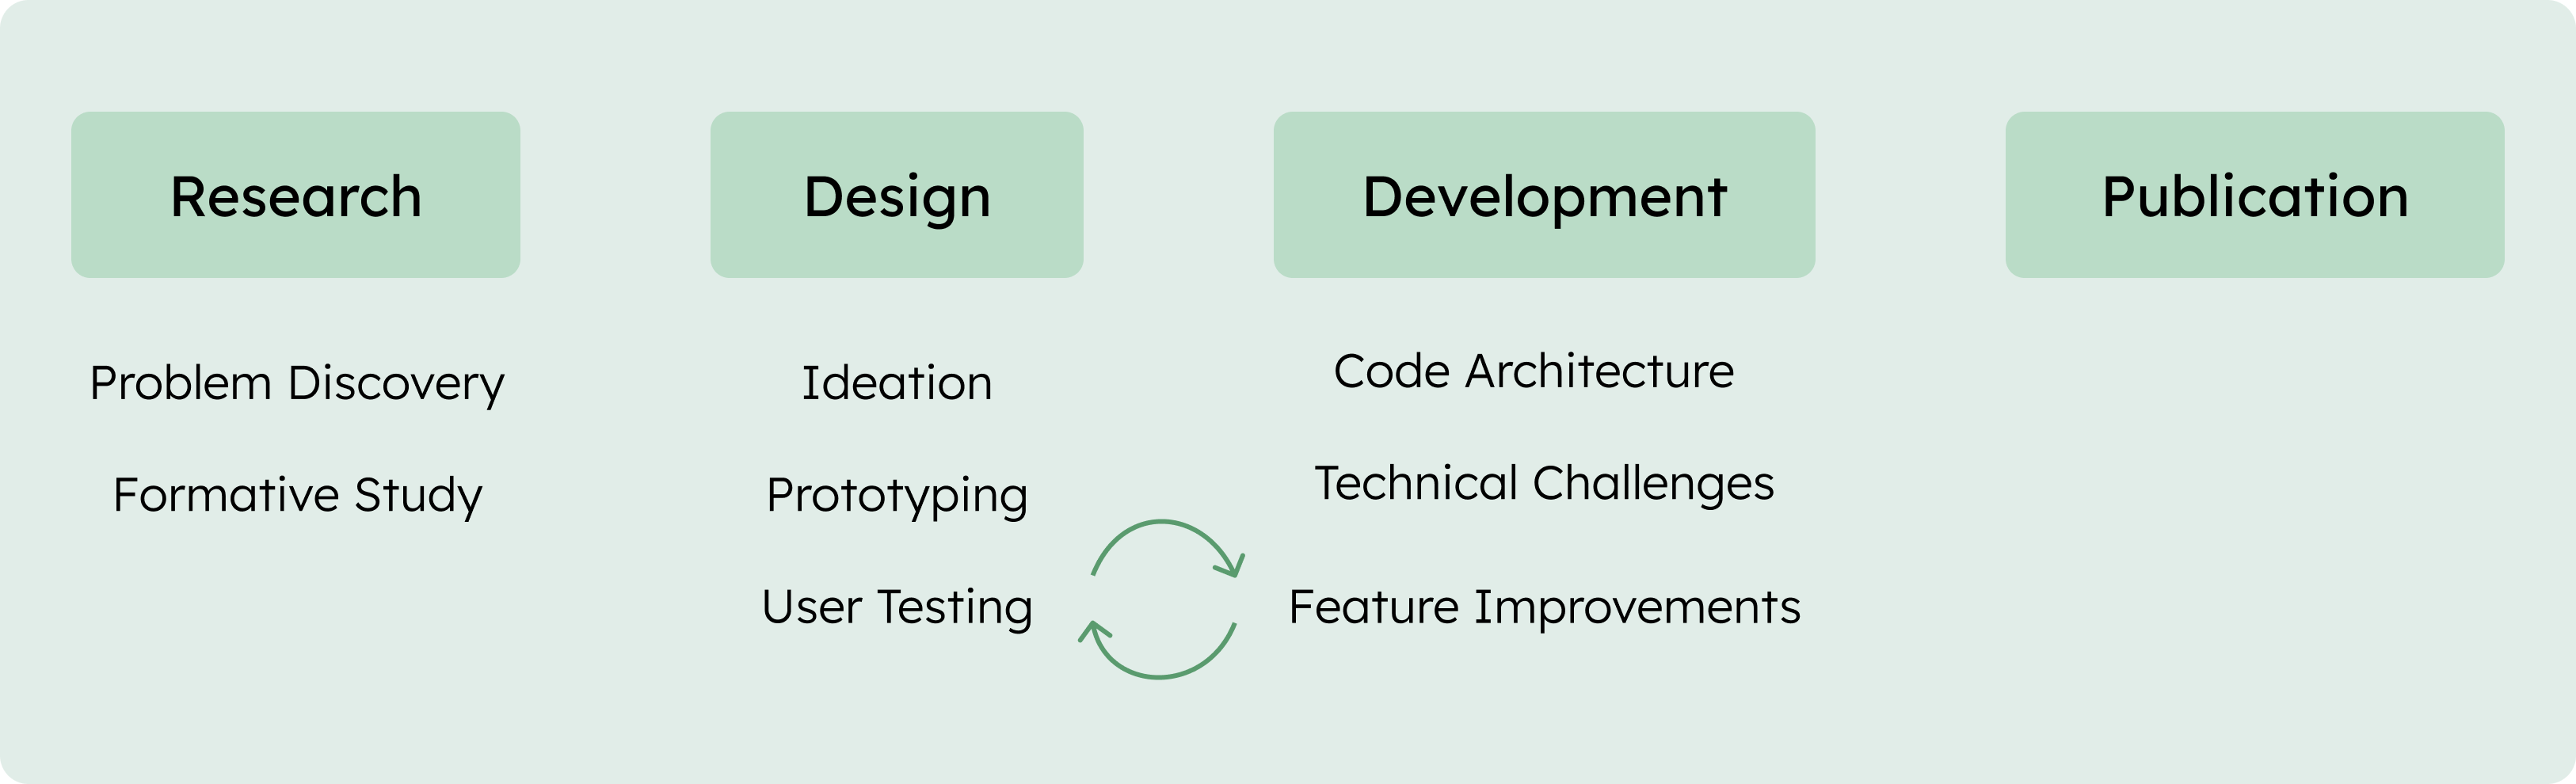
DESIGN & DEVELOPMENT
User Testing & Feature Improvements
I implemented an iterative design-build-test approach for the browser extension by first creating the design, developing the extension, and conducting user testing sessions with the functional product. This allowed users to interact with the extension in a real web environment, which revealed their natural browsing habits and areas of confusion. I then analyzed the testing data to identify the pain points, and implemented the design refinements.
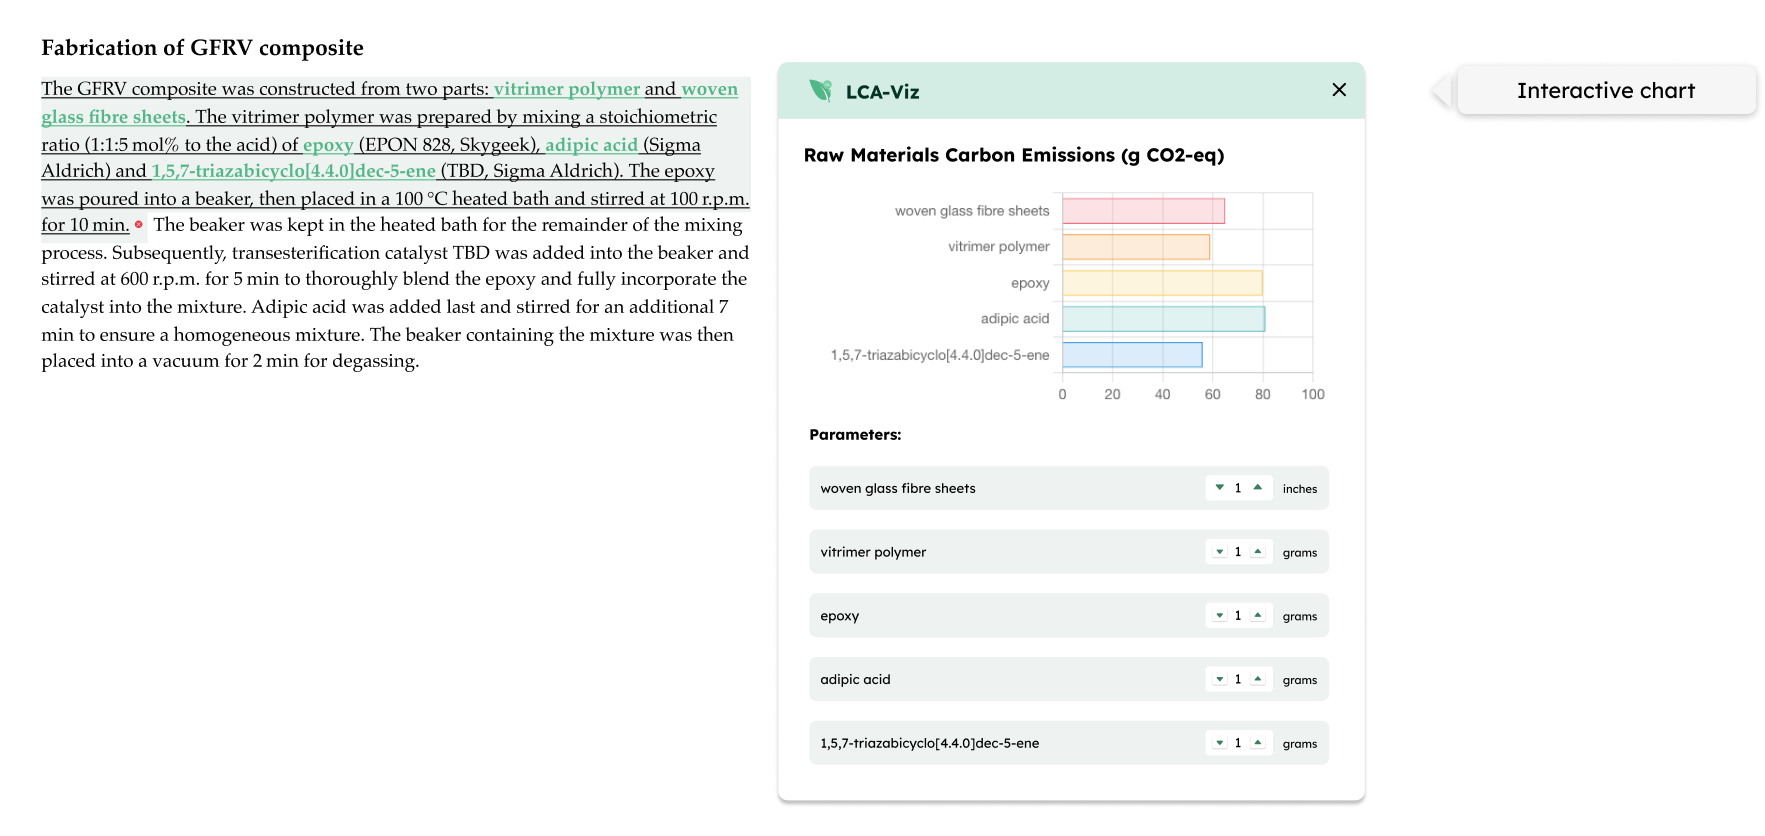
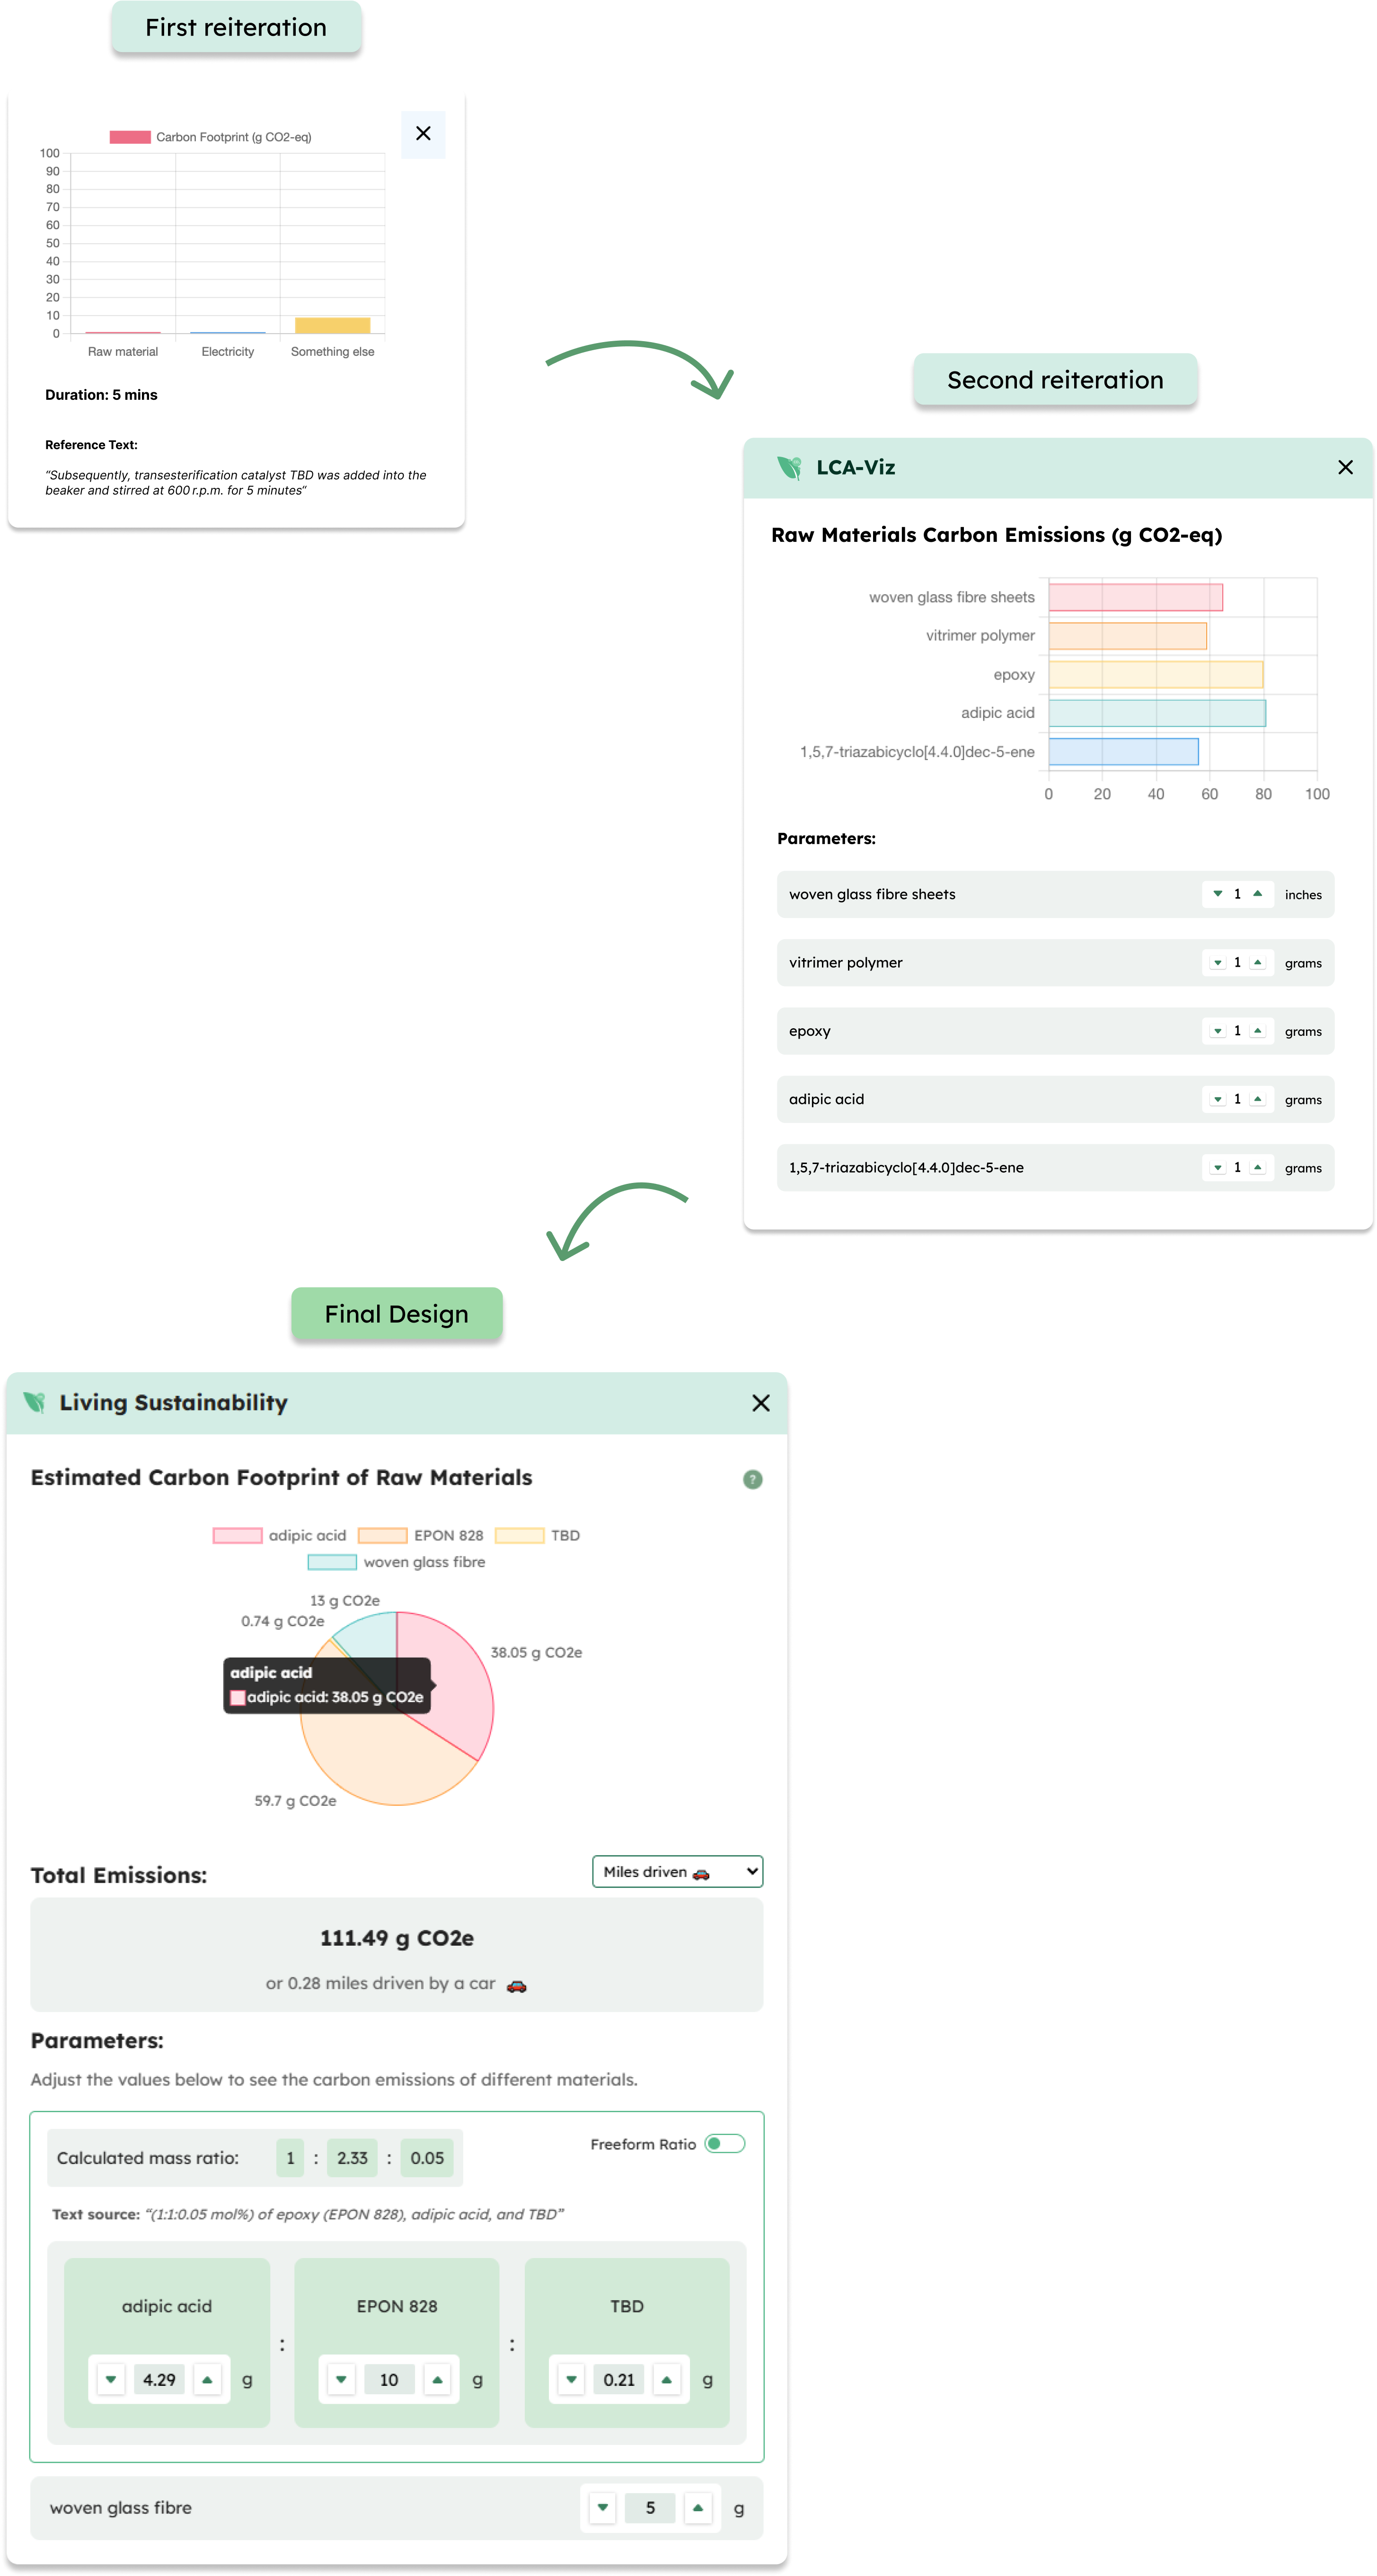
Interactive Chart
Final Design Justification:
Pie Chart: Changing the data visualization to a pie chart makes it easy for users to identify which raw materials have the largest environmental impact at a glance.
Total emissions: Include the total emissions with a unit of comparison (e.g. miles driven) to help users see a bigger picture.
Parameters: Implemented distinct UI patterns to establish a clear visual hierarchy and distinction between dependent materials (e.g. adipic acid, EPON 828, TBD) and standalone materials (e.g. woven glass fibre).
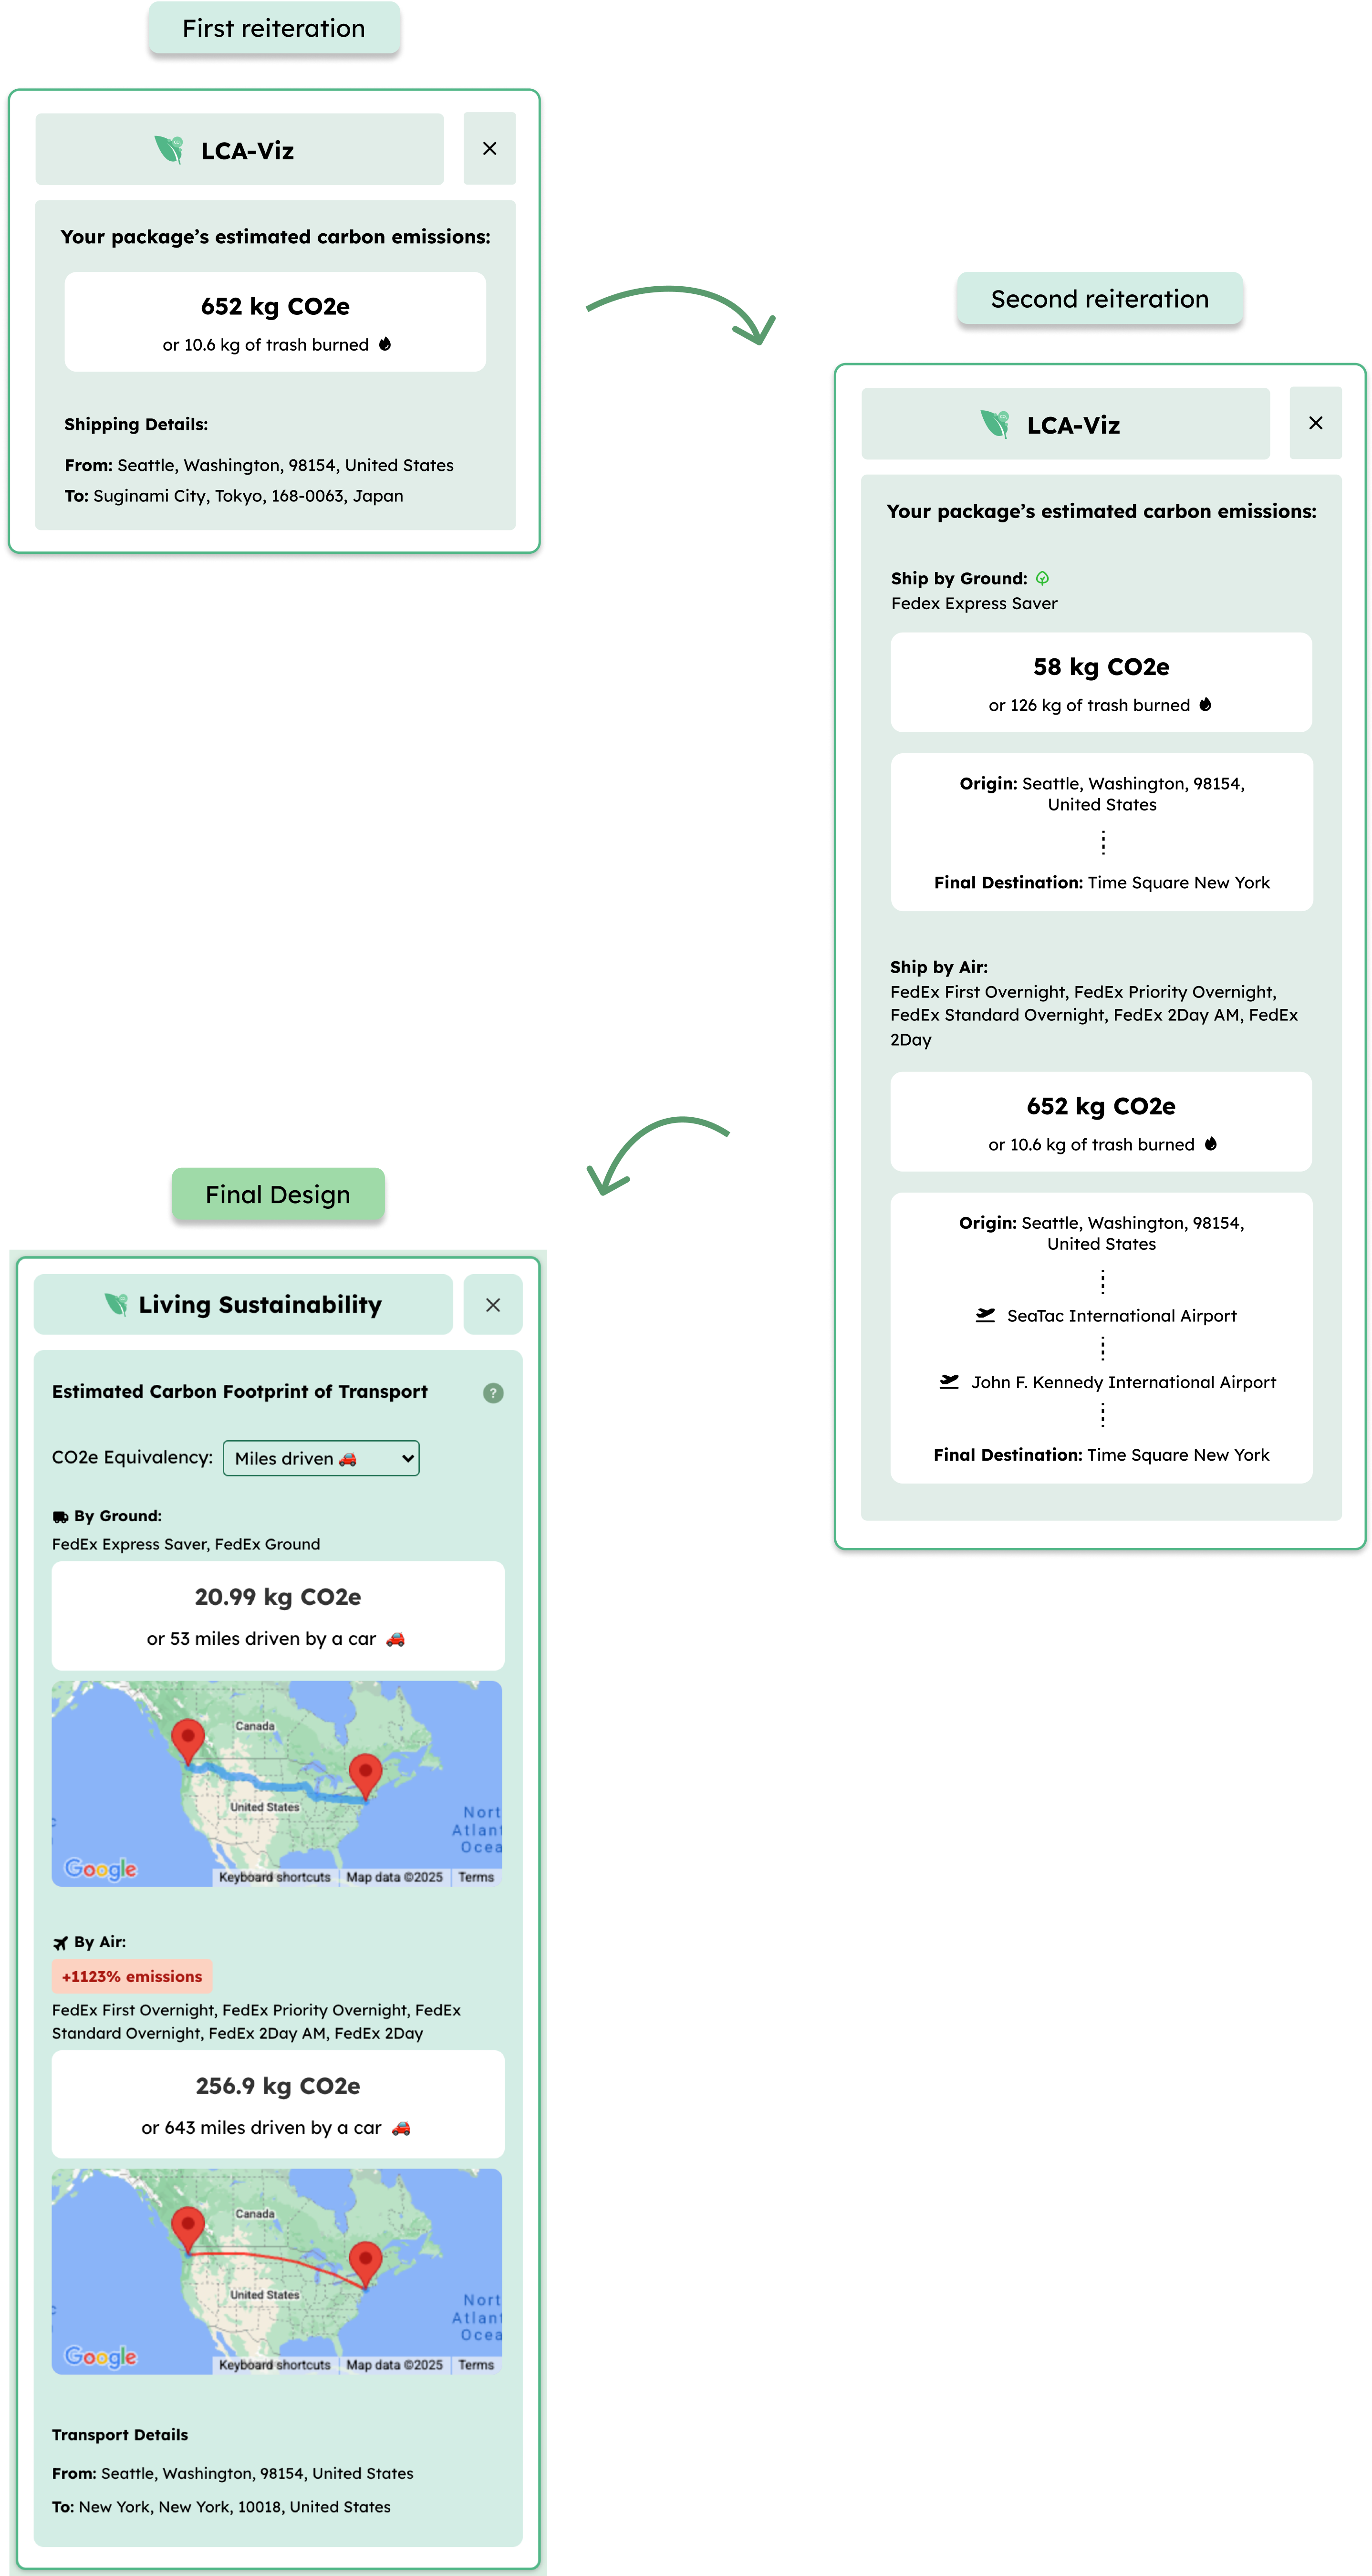
Carbon Emissions of Shipping
Final Design Justification:
Interactive Geo-Maps: Changing the data visualization to a pie chart makes it easy for users to identify which raw materials have the largest environmental impact at a glance.
Transportation Method Comparison: Include the total emissions with a unit of comparison (e.g. miles driven) to help users see a bigger picture.
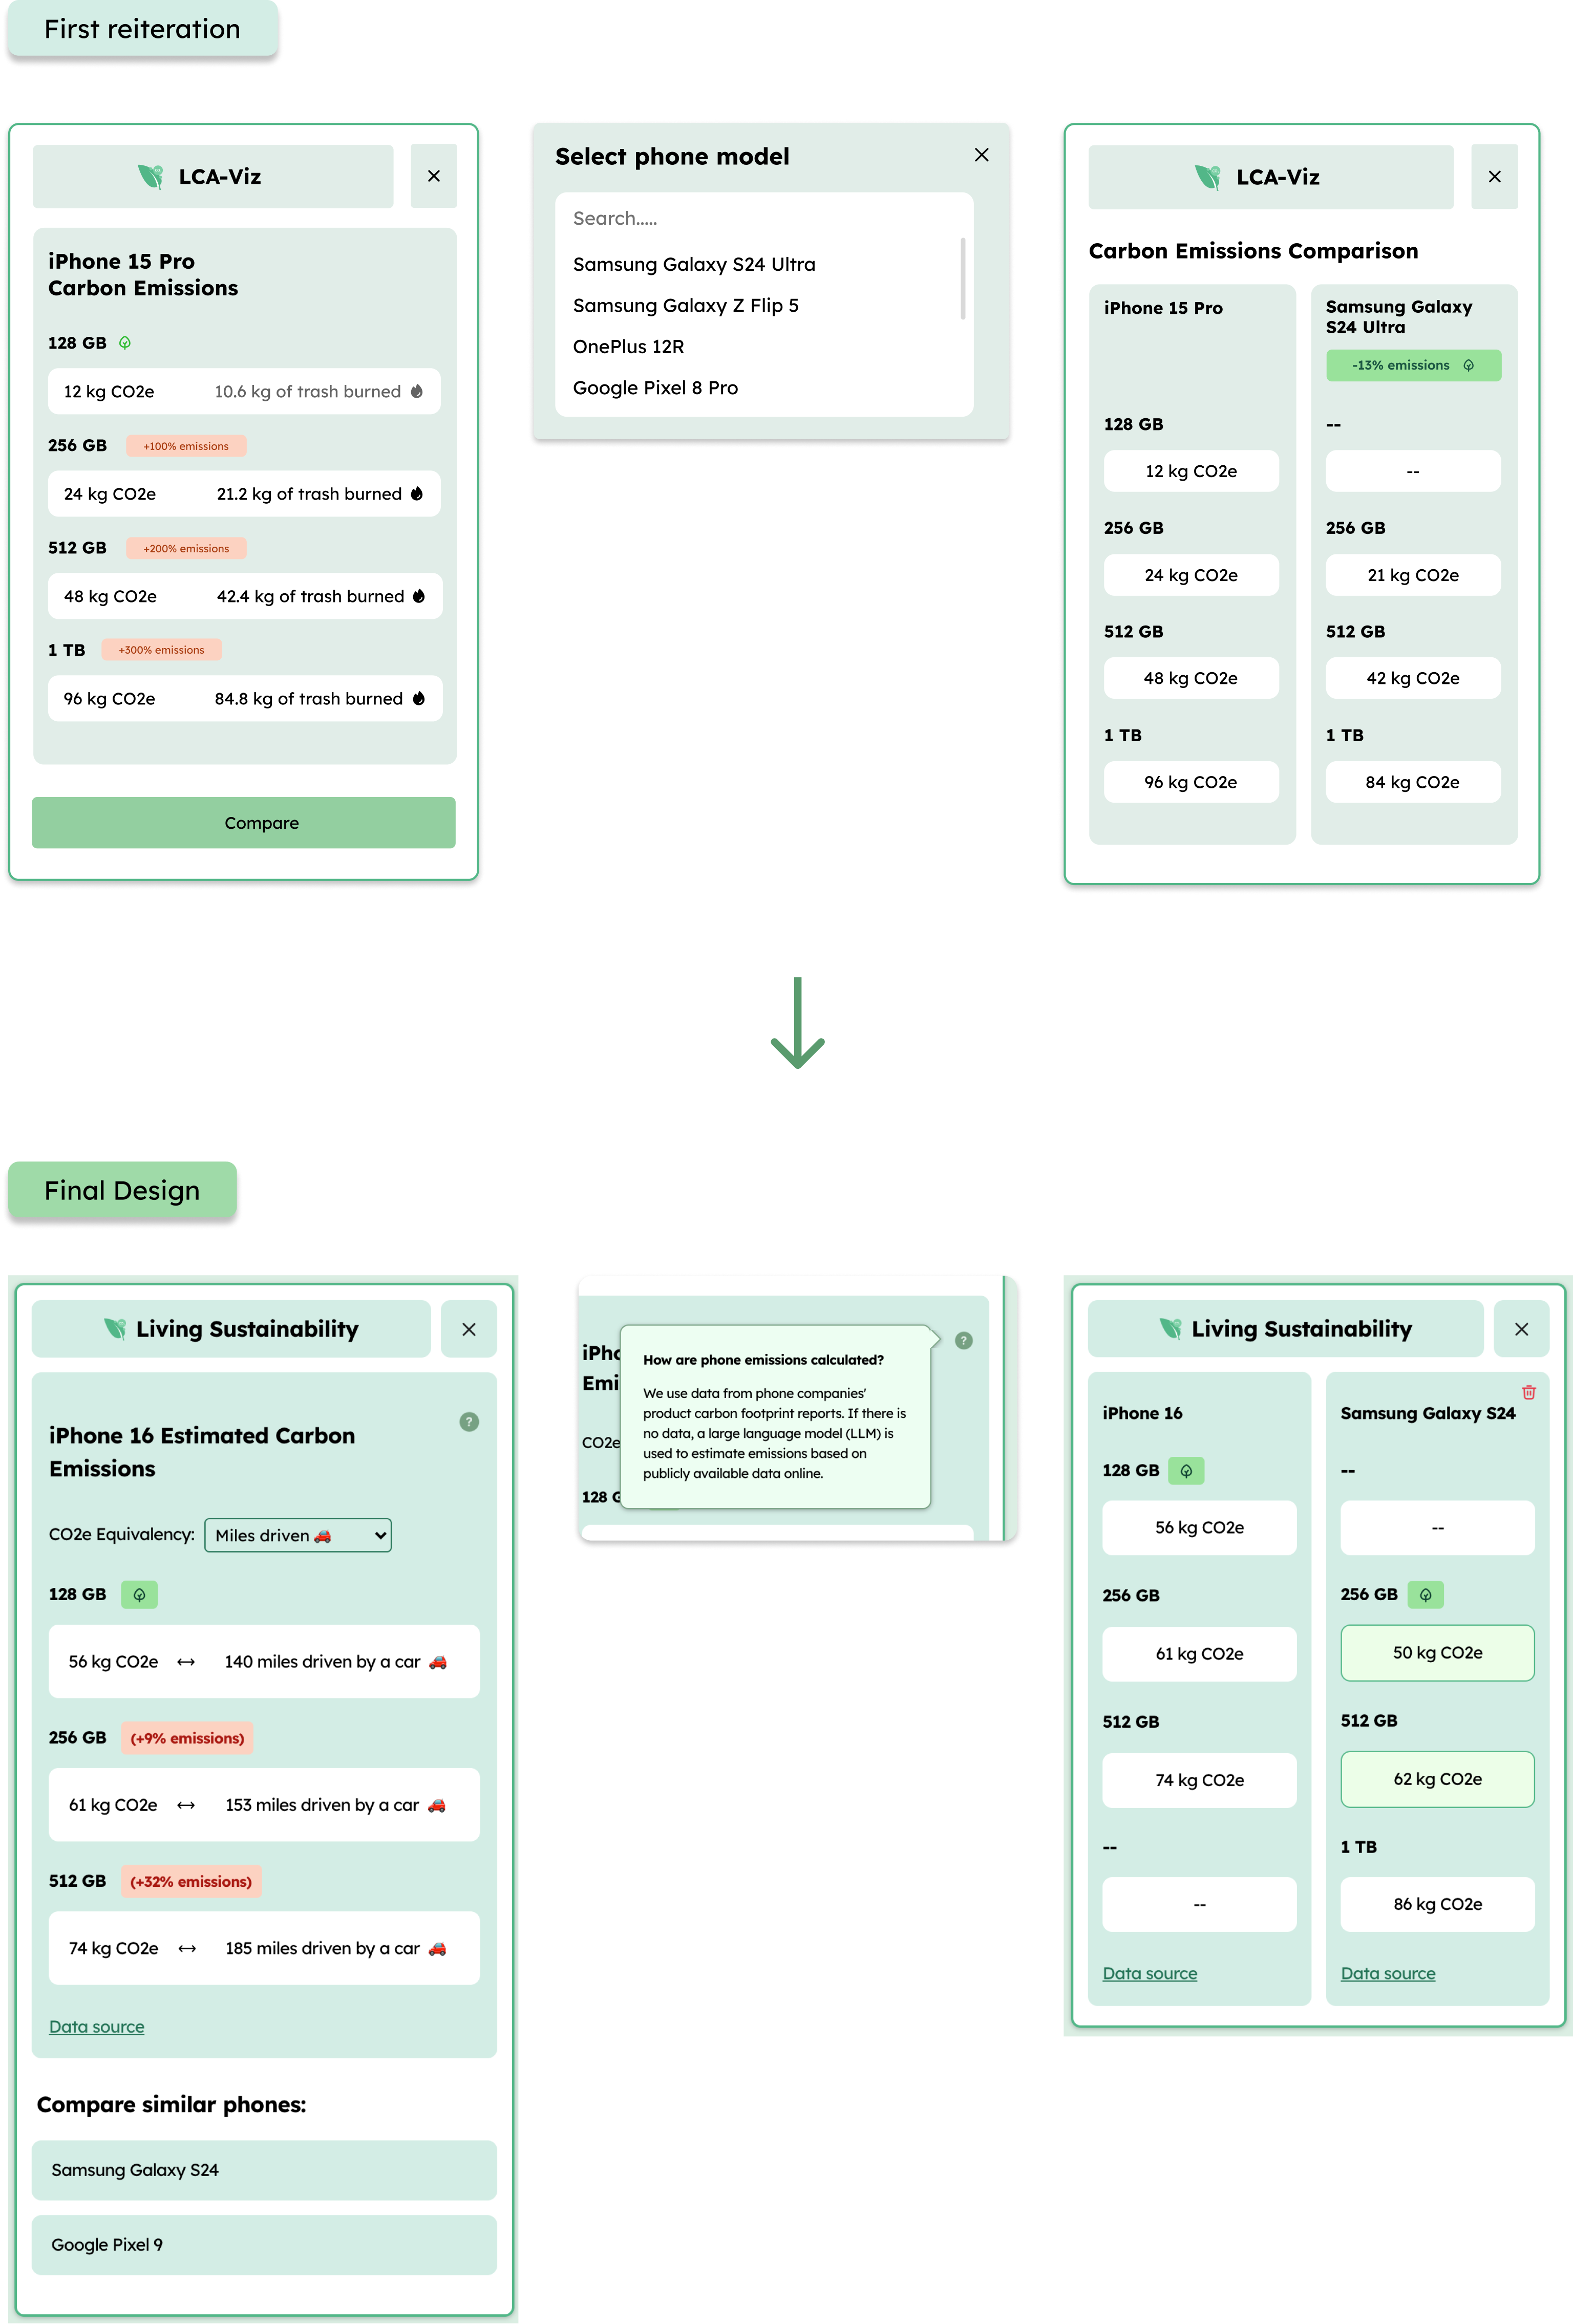
Carbon Emissions of Mobile Devices
Final Design Justification:
Phone comparison: Removed the “Compare” button as users found manual searching overwhelming. The design now automatically selects two similar phones by price and specs, which reduces cognitive load.
Data Source and Tooltip: Added “data source” and information tooltip to help users understand how the emissions are calculated and where the data is sourced from.
Emissions indicator: Clearly indicates which options are more eco-friendly by visually emphasizing the option with lower emissions through color coding.
DEVELOPMENT
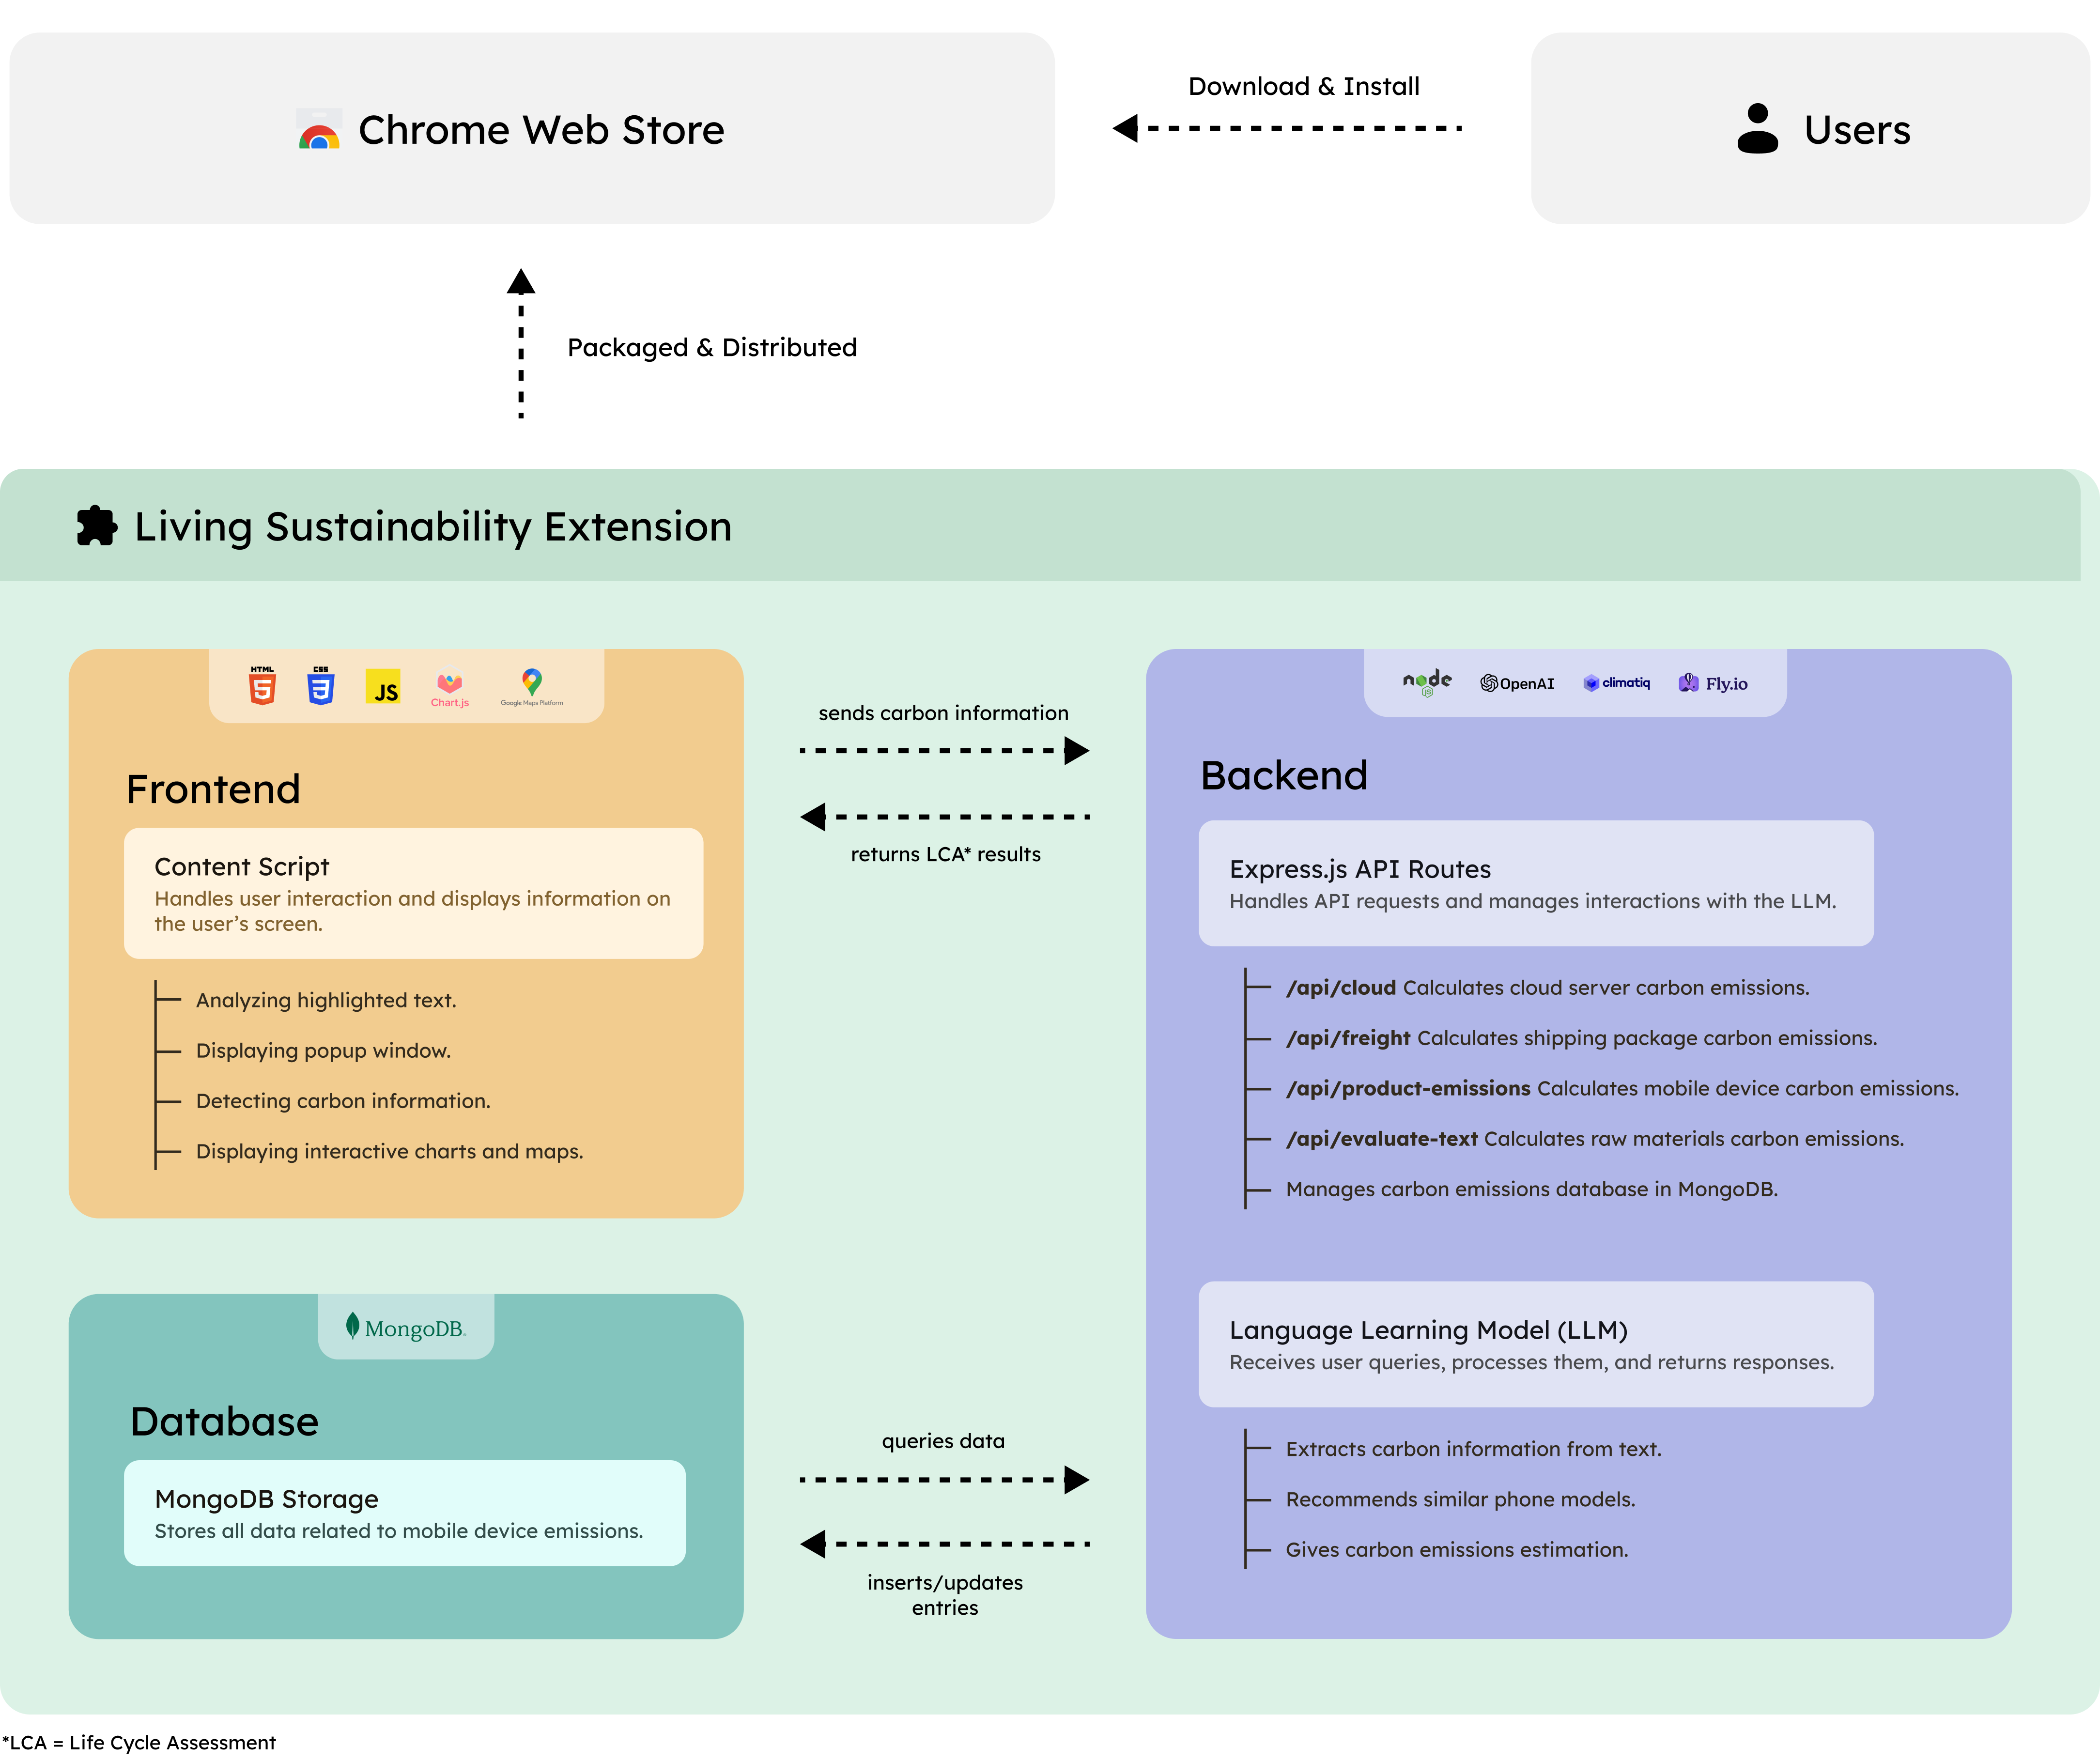
Code Architecture
Below is a diagram that roughly explains how Living Sustainability works under the hood.
DEVELOPMENT
Technical Challenges
Being my first time ever developing a browser extension, I was not familiar with the restrictions placed by Chrome’s Content Security Policy (CSP), which created many limitations not typically encountered in web or app development. This was a great learning opportunity for me as I had to come up with different workarounds and approaches to bypass the CSP.
These are some of the challenges I faced and how I solved them:
Problem: Cannot install 3rd party libraries
There are many 3rd party libraries I wanted to use like Chart.js, which is used to create interactive charts. These libraries are typically installed with npm or CDN scripts. However, CSP restricts the loading of external scripts/sources.
Solution: Using Command Line Interface (CLI)
I did a lot of research online and found Extension CLI. This tool is able to bypass CSP restrictions by bundling libraries like Chart.js directly into the extension's build process, ensuring they are loaded as part of the extension's packaged resources rather than from external sources. With this, I was able to use Chart.js with my extension.
Problem: Backends are not allowed
Chrome extensions cannot have a traditional backend because they are designed to run entirely client-side, with all resources and logic packaged within the extension itself for performance and security.
Solution: Hosting my backend in a remotely hosted server
I deployed my backend on a Node.js server and hosted it remotely with Fly.io. This allows the client-side to communicate with my hosted server through API calls, as the backend is not directly packaged with the client-side.
Problem: Google Maps API is restricted by CSP
Normal API calls that return text data are not restricted by CSP. However, the Google Maps API returns dynamically evaluated scripts to display a live geomap, which is strictly blocked by CSP.
Solution: Hosting geomap on the external server and importing it with iframes
I created a workaround to properly load maps in the extension by hosting external HTML webpages on my server that connect with our backend. When the extension needs to create the geomap, it calls an endpoint on the backend, which retrieves the data and writes it to a hosted .js file. The backend then triggers the client-side of the hosted HTML webpage to generate a geomap using the Google Maps API. Finally, the extension uses an <iframe> to embed the maps from the external HTML webpages.